
Azure Cloud Architecture Diagram: A Complete Guide to Designing, Documenting, and Communicating Cloud Infrastructure
Azure architecture diagrams are the visual language of cloud infrastructure. They map how Azure services, compute, storage, networking, databases, and security controls, interconnect to deliver applications and data. A well-designed diagram doesn't just show what you built, it communicates why you built it that way, creating a shared understanding across implementers, security reviewers, and business stakeholders.
This guide covers everything you need to know about Azure cloud architecture diagrams, what they are, the core components they include, the most common patterns, best practices that separate professional diagrams from confusing messes, and the tools you can use to create them.
Cloud Architecture
Create cloud architecture diagrams for AWS, Azure, GCP, and more. Design scalable infrastructure with professional cloud icons.
Complete guide to Azure cloud architecture diagrams, core components, hub-spoke and landing zone patterns, Well-Architected best practices, and tools.
Click Cloud Architecture to open AI Line Studio and generate diagrams from natural language in seconds.
What Is an Azure Cloud Architecture Diagram?
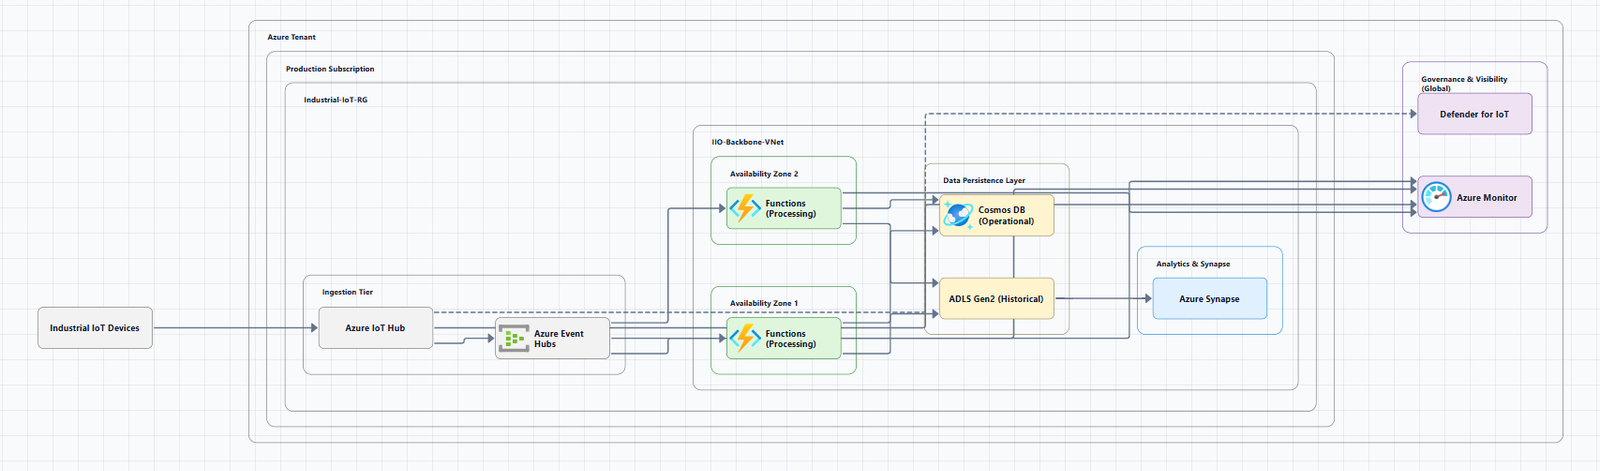
An Azure cloud architecture diagram is a visual representation of a system built on Microsoft Azure. It shows how Azure services, Virtual Machines, App Service, Azure Kubernetes Service (AKS), SQL Database, storage accounts, networking components, and security controls, are organized and connected to support an application or workload.
At a basic level, an architecture diagram explains what services are involved and how they relate within a solution. At a deeper level, it can show security boundaries, data flow, dependencies, and failure points. The level of detail depends on who the diagram is for and how it will be used.
Ultimately, the choice of architecture diagram depends on what you're trying to convey and your audience's questions. Architects use multiple types of diagrams throughout design activities, requirements refinement, and stakeholder communication, and they maintain multiple diagrams across envisioning, design elaboration, threat modeling, implementation, operations, and governance.
Core Azure Architecture Components
Every Azure diagram uses a common set of service categories. Understanding these is the first step to reading and creating diagrams.
Compute Services
Compute services provide the processing power for your applications:
| Service | Description |
|---|---|
| Azure Virtual Machines | IaaS virtual machines with full OS control |
| Azure App Service | PaaS for hosting web apps, REST APIs, and mobile backends |
| Azure Kubernetes Service (AKS) | Managed Kubernetes for container orchestration |
| Azure Functions | Serverless event-driven compute |
| Azure Container Instances | Serverless containers for simple workloads |
Storage Services
Storage services handle data persistence:
- Azure Blob Storage: Object storage for unstructured data
- Azure Files: Managed file shares
- Azure Disk Storage: Block storage for VMs
- Azure Data Lake Storage: Scalable data lake for analytics
Database Services
Database services manage structured and semi-structured data:
- Azure SQL Database: Managed relational database
- Azure Cosmos DB: Globally distributed NoSQL database
- Azure Database for PostgreSQL/MySQL: Managed open-source databases
- Azure Cache for Redis: In-memory caching
Networking Services
Networking services connect everything together:
- Azure Virtual Network (VNet): Your private network in the cloud
- Subnets: Segments of a VNet's IP address range
- Azure Load Balancer: Distributes traffic across VMs
- Application Gateway: Layer 7 load balancer with WAF
- Azure Front Door: Global load balancer and CDN
- Azure DNS: Domain name resolution
- VPN Gateway and ExpressRoute: Hybrid connectivity
Security and Management Services
Security and management services protect and monitor your infrastructure:
- Microsoft Entra ID (formerly Azure AD): Cloud-based identity and access management
- Azure Key Vault: Secrets, keys, and certificate management
- Azure Monitor: Monitoring service that collects, analyzes, and acts on telemetry data
- Azure Security Center: Security posture management
- Azure Policy: Governance and compliance enforcement
Integration and Messaging Services
Integration services connect applications and systems:
- Azure API Management: API gateway and developer portal
- Azure Event Hubs: Real-time data streaming
- Azure Service Bus: Reliable cloud messaging
- Azure Logic Apps: Workflow automation
- Azure Event Grid: Event routing at scale
Common Azure Architecture Patterns
Understanding common patterns helps you read and create diagrams faster. Here are the most frequently used Azure architectures.
1. Hub-Spoke Network Topology
The hub-spoke network pattern is the network topology recommended by the Cloud Adoption Framework for Azure. The hub virtual network acts as a central point of connectivity to many spoke virtual networks.
Hub virtual network: Hosts shared Azure networking services and is the central point of connectivity for cross-premises networks. It provides cross-premises gateway (VPN or ExpressRoute), egress control, ingress control, remote access, and routing.
Spoke virtual networks: Isolate and manage workloads separately. Each workload can include multiple tiers, with multiple subnets connected through Azure load balancers. Spokes can exist in different subscriptions and represent different environments, such as production and nonproduction.
When to use: Enterprise organizations with multiple environments and workloads requiring centralized security, connectivity, and shared services.
Download a Visio file of this architecture: hub-spoke-network-topology-architecture.vsdx
2. Azure Landing Zone Architecture
The Azure landing zone reference architecture is an example of scaled-out target architecture intended to help organizations operate successful cloud environments while maintaining best practices for security and governance.
Environment design areas:
| Design Area | Objective |
|---|---|
| Azure Billing and Active Directory Tenant | Proper tenant creation, enrollment, and billing setup |
| Identity and Access Management | Primary security boundary in the public cloud |
| Resource Organization | Subscription design and management group hierarchy |
| Network Topology and Connectivity | Foundational aspect of any cloud architecture |
Compliance design areas:
| Design Area | Objective |
|---|---|
| Security | Implement controls to protect your cloud environments |
| Management | Management baseline for visibility, operations compliance, and protect and recover capabilities |
| Governance | Automate auditing and enforcement of governance policies |
| Platform Automation and DevOps | Enable CI/CD and automation for platform resources |
Downloadable files: Visio and PDF files of the landing zone architecture are available from the Cloud Adoption Framework repository.
3. Microservices Architecture on AKS
Azure Kubernetes Service (AKS) microservices architectures decompose applications into collections of small, autonomous services.
Key components:
- AKS Cluster: Managed Kubernetes control plane and worker nodes
- Azure Application Gateway: Ingress with Web Application Firewall (WAF)
- Azure Service Bus: Reliable, asynchronous messaging between services
- Azure Container Registry: Container image storage
- Azure Monitor: Node-level and pod-level observability
When to use: Large, complex applications with multiple independent teams that need to deploy and scale services independently.
4. Event-Driven Microservices
This pattern decouples services through asynchronous messaging, ideal for systems where different components operate at different speeds or process high volumes of events reliably.
Key design decisions:
- Message Broker: Azure Service Bus for guaranteed ordered delivery; Azure Event Grid for event notifications
- Compute: Azure Container Apps with Dapr for built-in pub/sub; graduate to AKS for custom networking
- Processing: Azure Functions for event-driven processors that can scale to zero
- Data: Azure Cosmos DB allows each microservice to own its data with independent scaling
- API Management: Unified entry point with rate limiting and authentication
5. AI Workload Architecture
Azure provides architectural patterns and baseline reference architectures to help you design, deploy, and govern AI workloads on Azure.
Key architectural layers:
- Data Processing and Analytics: Gathers raw data, cleans it, and organizes it into datasets
- Model Training and Fine-Tuning: Trains and tracks models through a repeatable MLOps process
- Intelligent Application: User-facing layer combining models with application logic
- Platform Services: Core cloud services that secure resources, control costs, and monitor system health
6. Multi-Region AKS Architecture
For active/active highly available configurations, this architecture details how to run multiple AKS clusters across regions.
Key components:
- Azure Front Door: Routes traffic among all clusters; if one region fails, routes to the nearest healthy cluster
- Regional hub-spoke networks: Each region has its own hub-spoke topology
- Regional Key Vaults: For storing sensitive values and keys specific to each cluster
- Log Analytics workspaces: Regional workspaces for networking metrics; shared workspace for all AKS instances
Azure Architecture Diagram Best Practices
The Azure Well-Architected Framework provides clear guidance on diagramming practices. Following these recommendations ensures your diagrams are clear, accurate, and effective communication tools.
1. Use Standard Notations
Use widely recognized symbols, icons, and presentation conventions to ensure good readability and consistent interpretation across different audiences. Diagrams often show relationships between entities using lines; be consistent in how you represent these relationships throughout your diagrams.
2. Use Directional Arrows
Avoid lines without arrows, it's hard to know what the relationship is without direction. Avoid bidirectional arrows, double arrows imply bidirectional dependencies, which can create confusion. Prefer using a single-ended arrow to represent the flow from the initiating component (client) to the dependency (server).
When bidirectional communication exists, either show two separate flows (preferred) or annotate a single arrow with request/response notes.
3. Label Everything Clearly
Provide clear, accurate, and meaningful labels for each icon, grouping container, and relationship. Label lines when relationships aren't immediately obvious from context.
4. Maintain Consistency
Use standardized colors, casing, icons, icon sizes, line weights, line types, arrow heads, and border styles for similar elements. Apply the same taxonomy across every diagram in the solution set.
5. Be Accurate
While diagrams are abstractions, don't sacrifice accuracy for unnecessary simplicity. For example, don't depict a PaaS service inside a subnet if it's actually accessed over a private endpoint. Inaccuracies in diagrams can lead to serious miscommunication and implementation delays.
6. Include Metadata
Ensure each diagram contains metadata that provides essential context about its purpose, scope, and significance. Include elements such as title, description, last updated date, author, version, and external references.
7. Use Official Icons and Service Names
When representing specific technologies, always use the latest official icons and naming conventions. Microsoft provides an official collection of Azure architecture icons, updated regularly with new services.
Icon Usage Guidelines:
- Do: Use the icon to illustrate how products can work together. Include the product name somewhere close to the icon. Use the icons as they would appear within Azure.
- Don't: Don't crop, flip, or rotate icons. Don't distort or change icon shape in any way. Don't use Microsoft product icons to represent your product or service.
Recent icon updates:
- July 2026: Added over 10 new icons, including Azure DocumentDB, Azure Resiliency, AI Gateway, and Azure DDoS custom policies. Also includes 10 new or updated Microsoft Foundry icons.
- November 2025: Added 13 new icons, including Azure Kubernetes Service (AKS) Network Policy, Azure Local, and Azure Linux.
- August 2025: Added 10 new icons, including Azure Service Groups and Prometheus.
- March 2025: Added six new icons, including SQL Database Fleet manager.
8. Layer, Don't Overload
Resist the urge to encode every subsystem in a single diagram. Provide progressive disclosure: a context diagram leads to a container diagram, which leads to focused component or sequence diagrams.
Diagram organization example: Resources should be grouped by function (Network, Compute, Data, Security) with detailed node labels including configuration details. Logical grouping using subgraphs makes the architecture easy to understand.
9. Provide a Legend
If you introduce border or line semantics, for example, solid is a synchronous call while dash is asynchronous, include a compact legend.
Tools for Creating Azure Architecture Diagrams
You have several options for creating Azure architecture diagrams, from traditional manual tools to AI-powered generators.
Official Microsoft Resources
Azure Architecture Center: The primary source for reference architectures and downloadable Visio files. Browse all Azure architectures to find architecture diagrams and technology descriptions for reference architectures, real-world examples, and solution ideas for common workloads.
Microsoft Visio: The recommended tool for creating Azure architecture diagrams. Azure icons are provided as general-purpose SVG files that you can drag and drop into Visio. Each reference architecture in the Azure Architecture Center includes a descriptive article outlining the purpose, benefits, and design considerations for the solution.
AI-Powered Diagram Generators
AI-powered tools are transforming how architects create diagrams. Instead of dragging boxes, you describe your architecture in natural language, and the tool generates a professional diagram.
Visual Paradigm AI Cloud Architecture Studio: A browser-based, AI-first platform that aligns your infrastructure with the Azure Well-Architected Framework. You describe your infrastructure, and the AI renders a professional diagram featuring official Azure service icons. The AI engages in a discovery process, asking smart clarifying questions, and you can refine your model via conversation, type "Add a Web Application Firewall (WAF) to the front end and link the database to a private endpoint," and the diagram updates in real-time.
GenAI-DrawIO-Creator: An AI-powered draw.io diagram generator that creates, modifies, and enhances diagrams through natural language commands. Supports 34+ shape libraries including Azure, AWS, GCP, and Kubernetes.
Azure-DrawIO-MCP: Generates editable Azure architecture diagrams as .drawio files using official Azure icons from Draw.io's Azure2 SVG library. Supports 100+ Azure resource types including VMs, App Services, AKS, and SQL.
diagram-ai-generator: Professional AI-powered architecture diagram generator with multi-cloud support and MCP server integration. Create diagrams with provider-specific icons for Azure, AWS, GCP, and Kubernetes.
AI Line Studio: Generates Azure architecture diagrams from natural language descriptions in 15 to 20 seconds. For Azure-specific workflows, you can use the dedicated AI cloud diagram generator. If you're working across multiple providers, the AI architecture diagram builder supports Azure, AWS, GCP, and OCI.
Manual Diagramming Tools
Draw.io (diagrams.net): A free, browser-based tool with a built-in Azure shape library. Several Azure diagram templates are available in the template library: click Arrange > Insert > Template, expand the Cloud section, and select Azure.
Lucidchart: Cloud-based diagramming with Azure-specific templates, real-time collaboration, and extensive shape libraries.
Common Mistakes to Avoid
Mistake 1: No directional arrows. Lines without arrows make relationships unclear. Always use directional arrows to show the flow of data.
Mistake 2: No labels. Icons without text labels leave readers guessing which service is which. Include product names close to each icon.
Mistake 3: Inconsistent notation. Different arrow styles, icon sizes, or colors for similar elements confuse readers. Standardize across all your diagrams.
Mistake 4: Outdated diagrams. A diagram without a last-updated date is assumed to be wrong. Include metadata and update regularly. Retire diagrams that no longer accurately answer an active stakeholder question.
Mistake 5: Overloading one diagram. Trying to show everything in one diagram creates visual noise. Layer your diagrams by abstraction level.
Mistake 6: Inaccuracies. Don't sacrifice accuracy for unnecessary simplicity. Inaccuracies can lead to serious miscommunication and implementation delays.
Summary
Azure cloud architecture diagrams are essential for design, documentation, and communication. A well-crafted diagram shows how Azure services are organized and connected to support an application.
Key takeaways:
| Element | Description |
|---|---|
| Core components | Compute, storage, databases, networking, security, management, and integration services |
| Common patterns | Hub-spoke, Azure landing zone, microservices, event-driven, AI workloads, multi-region |
| Best practices | Use standard notations, directional arrows, clear labels, consistency, accuracy, metadata, official icons, and layered diagrams |
| Official icons | Available from the Azure Architecture Center as SVG files, updated quarterly |
| Tools | Microsoft Visio, Draw.io, Lucidchart, AI-powered generators |
Document and centralize architecture diagrams: Architecture diagrams are powerful tools that help implementers, security reviewers, and business stakeholders converge on a shared mental model, expose risks earlier, and reduce rework.
To start creating your own Azure cloud architecture diagrams, explore the Azure architecture diagram tool for templates and practical examples. For automated diagram generation, try the AI cloud diagram generator to turn an Azure description into a visual instantly. For complete system architecture beyond Azure, the AI system architecture generator covers distributed and enterprise system designs.
Stop spending hours on diagrams that will be outdated next week. Start documenting your Azure architectures in a way that actually keeps pace with your infrastructure.