
Azure Architecture Diagram: A Complete Guide to Designing and Documenting Cloud Infrastructure
Azure architecture diagrams are the visual blueprints of your Microsoft cloud infrastructure. They map how Azure services, compute, storage, networking, databases, and security controls, interconnect to deliver applications and data. But a diagram is only as valuable as the thinking behind it.
Diagrams are powerful communication tools that help implementers and stakeholders see the broad vision or dive deep into specific areas of a system. Whether you're documenting a simple web app or a complex enterprise landing zone, getting your diagrams right makes the difference between a design that's understood and one that's ignored.
This guide covers everything you need to know about Azure architecture diagrams: what they are, the core components they include, the most common patterns, best practices that separate professional diagrams from confusing messes, and the tools you can use to create them.
Cloud Architecture
Create cloud architecture diagrams for AWS, Azure, GCP, and more. Design scalable infrastructure with professional cloud icons.
Complete guide to Azure architecture diagrams, core components, hub-spoke and landing zone patterns, Well-Architected best practices, and tools for creating them.
Click Cloud Architecture to open AI Line Studio and generate diagrams from natural language in seconds.
What Is an Azure Architecture Diagram?
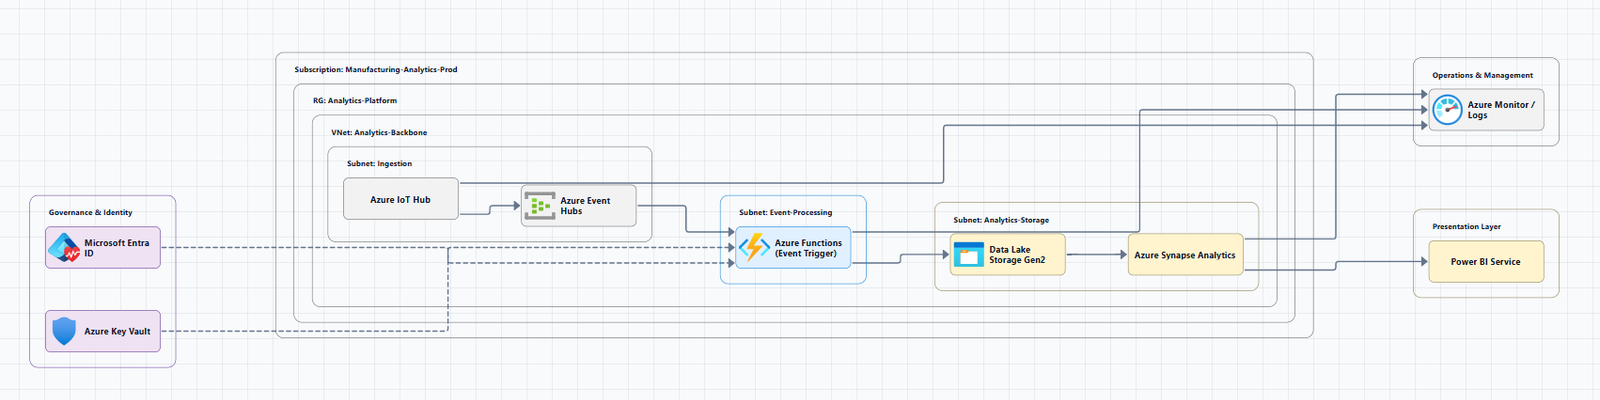
An Azure architecture diagram is a visual representation of a system built on Microsoft Azure. It shows how Azure services, Virtual Machines, App Service, Azure Kubernetes Service (AKS), Azure SQL Database, storage accounts, networking components, and security controls, are organized and connected to support an application or workload.
At a basic level, an architecture diagram explains what services are involved and how they relate within a solution. At a deeper level, it can show security boundaries, data flow, dependencies, and failure points. The level of detail depends on who the diagram is for and how it will be used.
Why Diagrams Matter
Architects often communicate through diagrams. A diagram isn't just a deliverable, it's a decision-making tool. It helps teams:
- Align early. A high-level diagram forces agreement on major components before coding starts.
- Identify gaps. Drawing relationships often reveals missing integrations or security boundaries.
- Communicate with stakeholders. Non-engineers can grasp a system's structure from a well-designed diagram.
- Document decisions. A diagram captures the "what" and the "how" of your architecture.
Core Azure Architecture Components
Every Azure diagram uses a common set of service categories. Understanding these is the first step to reading and creating diagrams.
Compute Services
Compute services provide the processing power for your applications:
- Azure Virtual Machines: IaaS virtual machines with full OS control.
- Azure App Service: PaaS for hosting web apps, REST APIs, and mobile backends.
- Azure Kubernetes Service (AKS): Managed Kubernetes for container orchestration.
- Azure Functions: Serverless event-driven compute.
- Azure Container Instances: Serverless containers for simple workloads.
In diagrams, compute resources are typically shown in the middle tier of a multi-tier architecture.
Storage Services
Storage services handle data persistence:
- Azure Blob Storage: Object storage for unstructured data.
- Azure Files: Managed file shares.
- Azure Disk Storage: Block storage for VMs.
- Azure Data Lake Storage: Scalable data lake for analytics.
Database Services
Database services manage structured and semi-structured data:
- Azure SQL Database: Managed relational database.
- Azure Cosmos DB: Globally distributed NoSQL database.
- Azure Database for PostgreSQL/MySQL: Managed open-source databases.
- Azure Cache for Redis: In-memory caching.
Networking Services
Networking services connect everything together:
- Azure Virtual Network (VNet): Your private network in the cloud.
- Subnets: Segments of a VNet's IP address range.
- Azure Load Balancer: Distributes traffic across VMs.
- Application Gateway: Layer 7 load balancer with WAF.
- Azure Front Door: Global load balancer and CDN.
- Azure DNS: Domain name resolution.
- VPN Gateway and ExpressRoute: Hybrid connectivity.
In diagrams, networking components are shown as containers (VNets, subnets) and as connection points.
Security and Management Services
Security and management services protect and monitor your infrastructure:
- Microsoft Entra ID (formerly Azure AD): Identity and access management.
- Azure Key Vault: Secrets, keys, and certificate management.
- Azure Monitor: Observability, metrics, and alerts.
- Azure Security Center: Security posture management.
- Azure Policy: Governance and compliance enforcement.
Additional Services
- Azure API Management: API gateway and developer portal.
- Azure Event Hubs: Real-time data streaming.
- Azure Service Bus: Reliable cloud messaging.
- Azure Logic Apps: Workflow automation.
- Azure DevOps: CI/CD and project management.
Common Azure Architecture Patterns
Understanding common patterns helps you read and create diagrams faster. Here are the most frequently used Azure architectures.
Pattern 1: Hub-Spoke Network Topology
The hub-spoke network pattern is a core Azure reference architecture where the hub virtual network acts as a central point of connectivity to many spoke virtual networks.
Components:
- Hub VNet: Contains shared services, Azure Firewall, VPN Gateway, Active Directory Domain Services, and Azure Bastion.
- Spoke VNets: Isolated workloads, production, staging, development, or different business units.
- VNet Peering: Connects spokes to the hub.
When to use: Enterprise organizations with multiple environments and workloads requiring centralized security and connectivity.
Key benefits: Centralized management of shared services, simplified network security, and logical isolation of workloads.
Pattern 2: Azure Landing Zone Architecture
The Azure landing zone reference architecture is a scaled-out target architecture intended to help organizations operate successful cloud environments while maintaining best practices for security and governance.
Design areas include:
- Management groups and subscription hierarchy
- Connectivity (hub VNet with Azure Firewall and VPN/ExpressRoute)
- Identity (Microsoft Entra ID, RBAC, Privileged Identity Management)
- Policy and governance (Azure Policy, Blueprints)
- Logging and monitoring (Azure Monitor, Log Analytics)
When to use: Organizations establishing a multi-account cloud foundation at scale. The conceptual architecture provides a recommended "north star" architecture for enterprise cloud adoption.
Pattern 3: N-Tier Web Application
The classic multi-tier web application architecture separates presentation, business logic, and data layers.
Components:
- Web Tier: Azure App Service or AKS with Application Gateway or Azure Front Door.
- Application Tier: Business logic running on VMs, App Service, or AKS.
- Data Tier: Azure SQL Database, Cosmos DB, or Storage.
When to use: Most production web applications and enterprise systems.
Pattern 4: Microservices on AKS
For containerized microservices, Azure Kubernetes Service (AKS) provides the orchestration layer.
Key components:
- AKS Cluster: Managed Kubernetes control plane and worker nodes.
- Azure Container Registry: Container image storage.
- Application Gateway Ingress Controller: HTTPS ingress with WAF.
- Azure Service Bus: Asynchronous messaging between services.
- Azure SQL/Cosmos DB: Per-service data stores.
Pattern 5: Serverless Architecture
Azure Functions and Logic Apps enable event-driven, serverless architectures.
Key components:
- Event sources: Event Grid, Service Bus, Event Hubs, Blob Storage triggers.
- Azure Functions: Serverless compute for business logic.
- Logic Apps: Workflow orchestration.
- Cosmos DB: Globally distributed NoSQL storage.
Pattern 6: AI Workload Architecture
Azure provides specific reference architectures for AI workloads covering core components, interactions, and best practices for building secure, scalable, and well-governed AI systems.
Key components:
- Azure Machine Learning: Model training and deployment.
- Azure AI Services: Cognitive services, Language Service, Computer Vision.
- Azure OpenAI Service: Access to large language models.
- Azure Cognitive Search: Retrieval-Augmented Generation (RAG).
Azure Architecture Diagram Best Practices
Microsoft's Azure Well-Architected Framework provides clear guidance on diagramming practices. Here's what actually works.
1. Use Standard Notations
Use widely recognized symbols, icons, and presentation conventions for good readability and consistent interpretation. Avoid ambiguous lines. Diagrams often show relationships between entities represented as lines; be consistent in how you use them.
2. Avoid Lines Without Arrows
It's hard to know what the relationship is without direction, so use arrows. Avoid lines with double arrows, they imply a bidirectional dependency. Prefer using a single-ended arrow to represent the flow from the dependent (client) to the dependency (server).
3. Label Everything
Provide clear, accurate, and meaningful labels for each icon. Label lines when the relationships aren't clear. In diagrams, Microsoft recommends including the product name somewhere close to the icon.
4. Maintain Consistency
Use standardized colors, casing, icons, icon sizes, line types, arrow heads, and other representations for similar elements throughout a diagram. Stay consistent across all diagrams created for your workload.
5. Be Accurate
Diagrams are abstractions, but don't sacrifice accuracy. For example, don't represent a service in a virtual network if it's not present in that virtual network. A diagram is a communication tool, so you need to avoid miscommunication from inaccuracies.
6. Include Metadata
Ensure that a diagram contains metadata that provides essential information about its purpose, scope, and significance. Include items such as title, description, last updated date, author, and external references.
7. Use Official Icons and Service Names
Use the latest official icons from Microsoft. If identifying the technology is important, use the official name for the service.
Official guidelines for Azure icons:
- Do: Use the icon to illustrate how products can work together. Include the product name somewhere close to the icon. Use the icons as they would appear within Azure.
- Don't: Crop, flip, or rotate icons. Distort or change icon shape in any way. Use Microsoft product icons to represent your product or service.
Common Mistakes to Avoid
Mistake 1: Ambiguous lines. Lines without arrows make relationships unclear. Always use directional arrows.
Mistake 2: No labels. Icons without text labels leave readers guessing. Include product names close to each icon.
Mistake 3: Inconsistent notation. Different arrow styles, icon sizes, or colors for similar elements confuse readers. Standardize across all your diagrams.
Mistake 4: Outdated diagrams. A diagram without a last-updated date is assumed to be wrong. Include metadata and update regularly.
Mistake 5: Overloading one diagram. Trying to show everything in one diagram creates visual noise. Layer your diagrams by abstraction level.
Mistake 6: Inaccuracies. A diagram is a communication tool; avoid miscommunication from inaccuracies.
Tools for Creating Azure Architecture Diagrams
Manual Tools
Draw.io (diagrams.net): A free, browser-based diagramming tool with a built-in Azure shape library. To enable Azure shapes: click More Shapes at the bottom of the left panel, select the Azure shape library under Networking, and click Apply. You can also import .vsdx files or exported diagrams from automated infrastructure documentation apps.
Microsoft Visio: Azure icons are provided as general-purpose SVG files that you can drag and drop into Visio.
Figma: The FigJam platform provides free Azure architecture diagram templates.
Visual Paradigm Online: Free non-commercial Azure diagram tool with no limits on diagrams or shapes.
AI-Powered Tools
AI-powered tools are transforming how architects create diagrams. Instead of dragging boxes, you describe your architecture in natural language, and the tool generates a professional diagram.
AI Line Studio takes this prompt-first approach with Azure support. Describe your system, "a web app on Azure with App Service, Azure SQL Database, and Azure Front Door", and it generates a structured diagram with official Azure icons in 15 to 20 seconds. The output supports PNG, GIF, and MP4 exports, plus shareable documentation links. For Azure-specific workflows, the dedicated AI cloud diagram generator turns Azure descriptions into production-ready visuals. If you're working across multiple providers, the AI architecture diagram builder supports AWS, Azure, GCP, and OCI.
The honest limitation: AI Line Studio is an early-stage product with a smaller install base and fewer third-party integrations than established tools like Visio or Lucidchart. It's not a general-purpose diagramming tool, if you need org charts, mind maps, or non-technical diagrams, a broader tool is a better fit. And as with any AI-generated output, complex or ambiguous system descriptions may need manual cleanup. It's not a zero-review tool for mission-critical documentation.
Azure Cloud AI Visualizer by CortexGrid is another free, open-source tool that generates Azure architecture diagrams and supports Infrastructure-as-Code (Bicep and Terraform).
Automated Infrastructure Documentation Tools
Tools like Cloudockit can export Azure diagrams from live infrastructure for import into draw.io.
CloudNetDraw generates Azure network diagrams (HLD and MLD) directly from your Azure environment.
Azure Architecture Diagram Types
Microsoft's Azure Well-Architected Framework recognizes multiple diagram types for different purposes:
High-level system diagram: Serves as a broad overview of a whole workload or of a subsection. It includes the main components, their relationships, and the rough order in which data flows through the system. Arrows show the direction of interaction.
Block diagram: Breaks down a workload into its major functional blocks. The blocks are usually technology agnostic and refer to the functionality that's being delivered.
Draw.io suggests layering Azure diagrams from overview to detail:
- Azure architecture overview: Design principles and broad service choices.
- High-level diagrams: Azure services, configurations, resource groups, VNets, environments, availability zones, monitoring, backup.
- Low-level diagrams: Implementation details, CI/CD pipelines.
Summary
Azure architecture diagrams are essential for design, documentation, and communication. A well-crafted diagram shows how Azure services are organized and connected to support an application.
Key takeaways:
- Core components: Compute, storage, databases, networking, security, and management services.
- Common patterns: Hub-spoke, landing zone, n-tier web app, microservices on AKS, serverless, and AI workloads.
- Best practices: Use standard notations, avoid lines without arrows, label everything, maintain consistency, be accurate, include metadata, and use official icons.
- Common mistakes: Ambiguous lines, no labels, inconsistent notation, outdated diagrams, overloaded diagrams, and inaccuracies.
- Tools: Draw.io (free, browser-based), Microsoft Visio, Figma, and AI-powered tools like AI Line Studio.
The tooling landscape has shifted. AI-powered generators can now turn natural language descriptions into production-ready Azure diagrams in seconds, changing the workflow from hours of manual dragging to seconds of generation with minutes of review. If you're tired of fighting diagramming tools, try using an AI cloud diagram generator to see how quickly you can turn an Azure description into a visual. For broader architecture needs beyond Azure, the AI system architecture generator covers hybrid and multi-service designs. And to see how these concepts translate into production-ready visuals, explore our Azure architecture diagram tool for templates and examples.
Stop spending hours on diagrams that will be outdated next week. Start documenting your Azure architectures in a way that actually keeps pace with your infrastructure.