
How to Create AWS Architecture Diagrams That Help Your Team Understand
A well-crafted AWS architecture diagram is one of the most powerful communication tools a team can have. It transforms complex systems into a shared visual language that aligns everyone, from developers and operations to security teams and business stakeholders. But creating a diagram that truly helps your team understand AWS is about clarity and intent, not just aesthetics.
Here's a practical guide to creating AWS architecture diagrams that serve as a "shortcut to trust," demonstrating that you understand best practices and have built your product for scale.
Cloud Architecture
Create cloud architecture diagrams for AWS, Azure, GCP, and more. Design scalable infrastructure with professional cloud icons.
Practical guide to creating AWS architecture diagrams for your team, know your audience, core design principles, step-by-step workflow, common pitfalls, and tools for collaboration.
Click Cloud Architecture to open AI Line Studio and generate diagrams from natural language in seconds.
1. Know Your Audience and Purpose
Before you start, define who the diagram is for and what you want it to achieve.
- For Technical Teams (Engineers, DevOps): Focus on implementation details, service interactions, dependencies, and failure points. Show the how.
- For Non-Technical Stakeholders (Product, Finance, Executives): Focus on the high-level structure, business value, security boundaries, and cost considerations. Show the why.
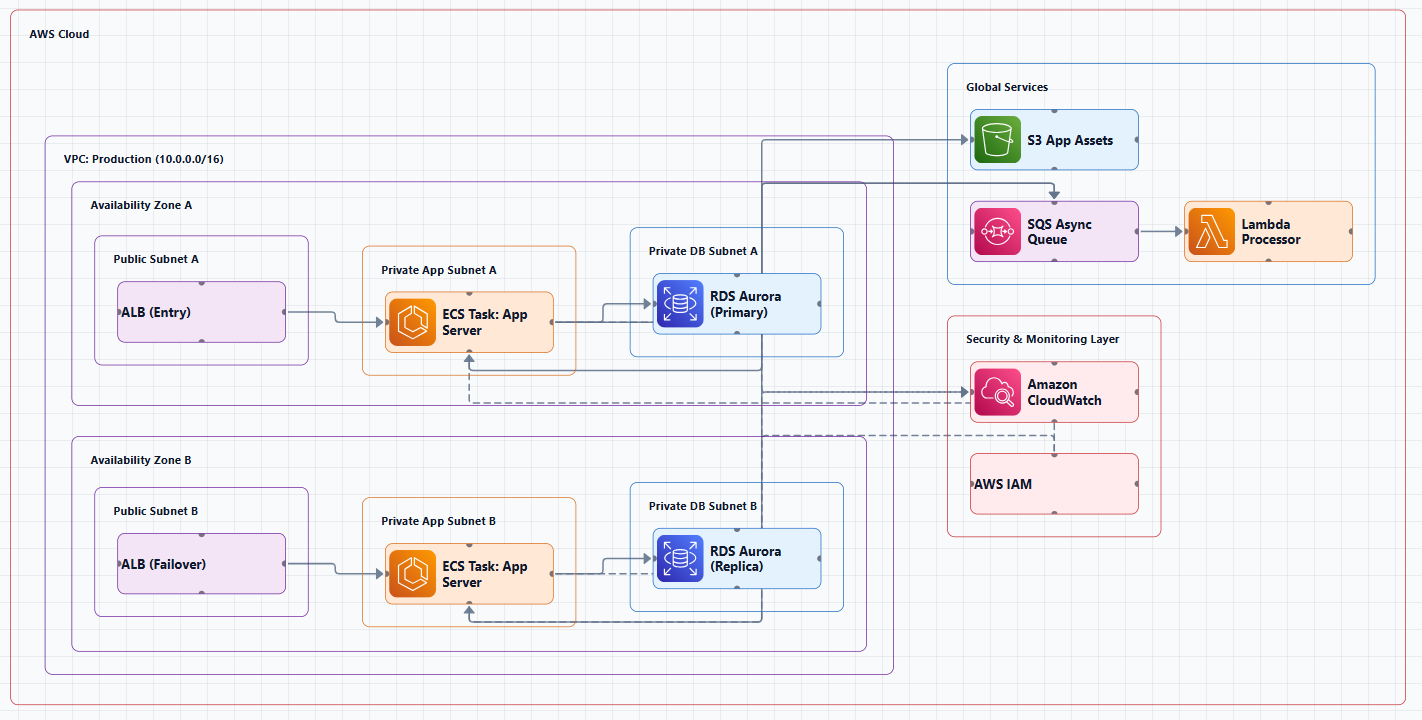
A single diagram often won't serve both audiences. Consider creating different "views" of your architecture for different purposes.
2. Follow the Core Principles of a Great AWS Diagram
A strong diagram tells a clear story about how your system runs on AWS.
Use Official AWS Icons
Using standardized icons makes diagrams easier to read because the visual language is familiar to cloud engineers and architects alike. Always use the official AWS Architecture Icons.
Label Everything Clearly
Never leave a service unlabeled. Instead of a generic "DB," write "Amazon RDS (PostgreSQL)". The icon tells the viewer the type of service; the label tells them the purpose.
Show the Full Picture
A comprehensive diagram should include:
- Main Services: The core AWS services used.
- Network Boundaries: VPCs, subnets, and Availability Zones.
- User Entry Points: Where and how users interact with the system.
- Data Flow: How data moves between components.
- Security Boundaries: Where IAM, VPCs, and other security controls are applied.
Design for Clarity
- Use a North-South Orientation: Place external users/internet at the top and internal resources at the bottom.
- Group by Function: Organize resources by logical tiers (e.g., Web, Application, Data) or security boundaries.
- Maintain Consistent Spacing: Use clear, consistent spacing to prevent a cluttered look. A good rule of thumb is 180px horizontal and 120px vertical gaps between service groups. For complex diagrams with over 13 services, increase this to 220px and 160px.
- Use Clean Aesthetics: A white or light-gray background with monochrome AWS icons creates a clean, professional look that reviewers appreciate.
3. A Step-by-Step Guide to Creating Your Diagram
Step 1: Define the System Scope and Level of Detail
Decide what you are diagramming. Is it a single application, a full data pipeline, or an entire enterprise platform? This will determine the level of detail you need.
Step 2: Gather AWS Components
List all the services that are part of your architecture, including networking and monitoring tools.
Step 3: Map Out Data Flows and Relationships
Understand how data moves through your system. How do components interact? What are the dependencies? This is the story your diagram will tell.
Step 4: Choose Your Tools
Select the right tool for the job.
- AI-Powered Generation: For speed and rapid iteration, tools like AI Line Studio can turn plain-language descriptions into production-ready diagrams in 15 to 20 seconds, using official AWS icons.
- Manual Diagramming: Tools like draw.io and Lucidchart remain popular for their control and flexibility.
- Diagram as Code: For version-controlled diagrams, use tools like the Python
diagramslibrary.
Step 5: Use Your Diagram for Team Collaboration
An architecture diagram is a living document. Use it as a shared reference point in meetings, design reviews, and during incident response. Teams often use collaborative whiteboards to build and maintain accurate diagrams together.
4. Avoid These Common Pitfalls
- Only Showing Internal Infrastructure: AWS reviewers and stakeholders want to know how users interact with the system, not just what's inside your VPC.
- Using Vague Labels: Saying "Data Engine" or a generic "DB" is not helpful. Use precise, technical terms.
- Not Labeling Data Flows: Arrows without labels don't tell you what's happening (e.g., is it an API call, a read, or a write?).
- Creating a "Master Diagram": Trying to cram everything into one view is a recipe for confusion. Split complex systems into multiple, focused diagrams.
- Letting Diagrams Go Stale: Outdated diagrams are worse than no diagrams at all. They create false confidence. Make updating diagrams part of your regular workflow.
5. Tools to Help Your Team
- AI Line Studio: Generate diagrams instantly from text descriptions, supporting 3,000+ official icons across AWS, Azure, GCP, and OCI. This is ideal for rapid prototyping and documentation. Use the AI cloud diagram generator for quick iteration, the AI architecture diagram builder for collaborative editing, and the AI system architecture generator for end-to-end designs. The cloud architecture diagram tool provides editable templates to get you started.
- draw.io (diagrams.net): A free, widely-used tool with built-in AWS shape libraries.
- Lucidchart: A popular professional tool with extensive AWS integrations.
- Kiro CLI with MCP: Use generative AI through natural language prompts to create professional diagrams in minutes rather than hours.
- Terraform-based Tools: Tools like
terraformgraphcan generate interactive architecture diagrams directly from your Terraform configurations, ensuring your diagrams always match your infrastructure.
Conclusion
An effective AWS architecture diagram is a vital communication tool that helps your team understand, build, and operate your cloud systems. By focusing on clarity, using official icons, labeling everything, and showing the full picture, you create a shared reference point that aligns technical and non-technical stakeholders alike. A great diagram doesn't just impress, it clarifies, builds trust, and demonstrates that you've built your system with best practices in mind.