
GCP Data Architecture Diagram: A Practical Guide to Modern Data Platforms on Google Cloud
Data architecture diagrams are the blueprints of your analytics infrastructure. They show how data moves from source to insight, where it's ingested, how it's transformed, where it's stored, and how it's consumed. Get the architecture wrong, and you'll pay for it in performance problems, spiraling costs, and teams that can't find the data they need.
After years of designing data platforms on Google Cloud, from streaming analytics to petabyte-scale data warehouses, I've learned that good data architecture isn't about using every service. It's about choosing the right pattern for your workload and drawing the diagram that makes that pattern obvious to everyone on your team.
This guide walks through production-tested GCP data architecture patterns, complete with diagram structures, service choices, and the tradeoffs you'll actually face.
Cloud Architecture
Create cloud architecture diagrams for AWS, Azure, GCP, and more. Design scalable infrastructure with professional cloud icons.
Practical guide to GCP data architecture diagrams, Medallion (Bronze/Silver/Gold), streaming pipelines, batch ETL, lakehouse, Data Mesh, reference platforms, and common mistakes.
Click Cloud Architecture to open AI Line Studio and generate diagrams from natural language in seconds.
The Foundation: Core GCP Data Services
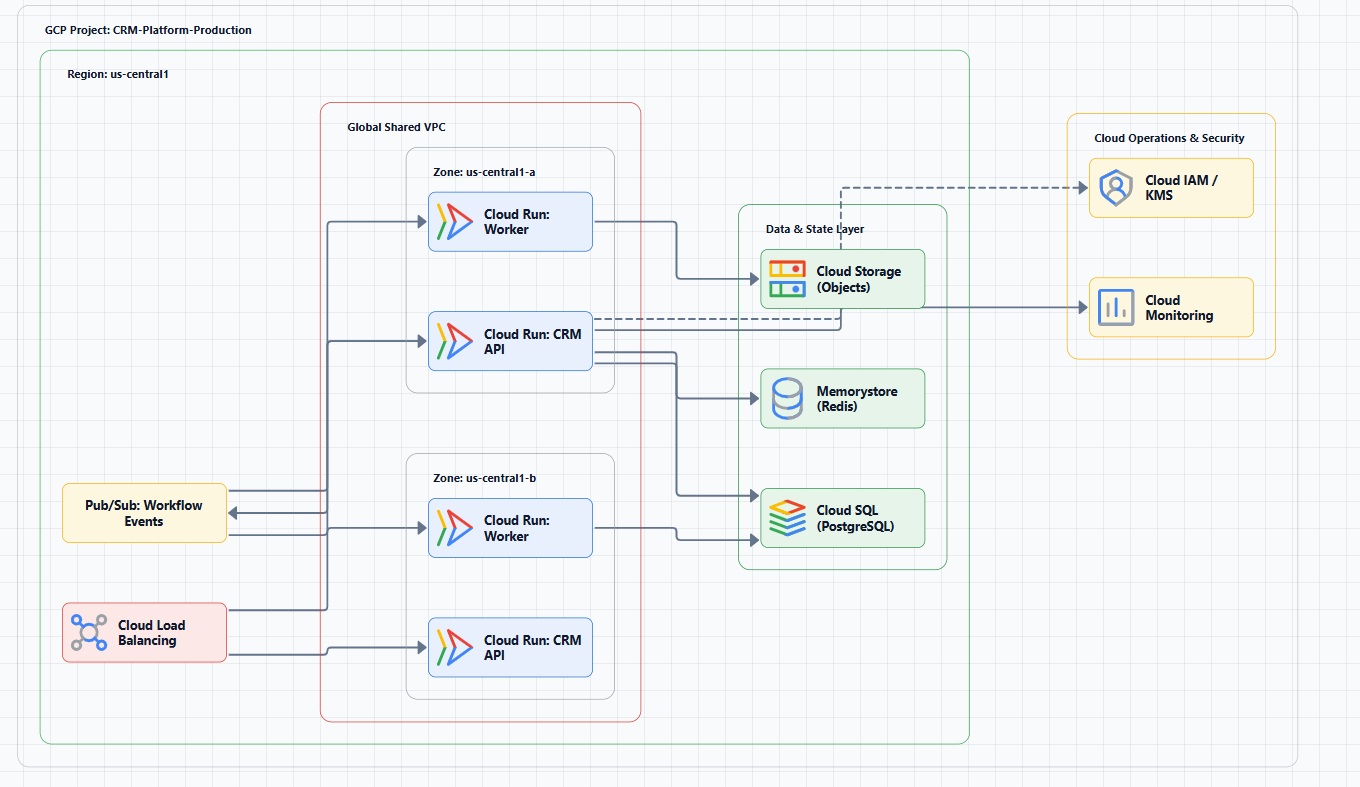
Before diving into patterns, understand the services that form the building blocks of any GCP data architecture.
| Layer | Key Services | Purpose |
|---|---|---|
| Ingestion | Pub/Sub, Cloud Storage, Cloud Data Transfer | Get data into GCP |
| Processing | Dataflow, Dataproc, Cloud Functions | Transform and enrich |
| Storage | Cloud Storage, BigQuery, BigLake | Store raw and processed data |
| Orchestration | Cloud Composer (Apache Airflow) | Schedule and manage pipelines |
| Governance | Dataplex, Data Catalog | Discover, manage, and secure data |
| Analytics | BigQuery, Looker, Vertex AI | Query, visualize, and build ML |
Processing is where Dataflow (Apache Beam) shines for both stream and batch. Storage has evolved, BigLake now brings the lakehouse pattern to GCP by letting you query open-format files in Cloud Storage with BigQuery's engine. Governance is non-negotiable at scale; Dataplex and Data Catalog are what turn a data swamp into a data lake.
The Medallion Architecture: Bronze → Silver → Gold
The Medallion architecture is the most common pattern for GCP data platforms. It organizes data into three layers, each serving a distinct purpose:
Bronze Layer (Raw)
Data lands here exactly as it arrives, no transformations, no cleaning. Cloud Storage is the primary home, storing files in Parquet, Avro, or JSON formats. In streaming scenarios, Pub/Sub may also feed directly into this layer.
Purpose: Preserve the original data. You can always reprocess from Bronze if requirements change.
Silver Layer (Cleaned)
Data is validated, deduplicated, standardized, and enriched. This is where the real data engineering happens, Dataflow pipelines read from Bronze, apply transformations, and write to Silver.
Purpose: Provide a reliable, clean dataset that's ready for business logic. Silver is often where data quality rules are enforced.
Gold Layer (Curated)
Data is aggregated, modeled, and optimized for specific business use cases. This is your analytics-ready data, star schemas, denormalized tables, pre-computed aggregates.
Purpose: Serve as the source for dashboards, ML models, and operational applications.
Diagram structure:
[Data Sources] → Bronze (Cloud Storage - Raw) → Dataflow → Silver (Cloud Storage/BigQuery - Cleaned)
                                                              ↓
                                                      Dataflow/Cloud Composer
                                                              ↓
                                                      Gold (BigQuery - Curated)
                                                              ↓
                                              [Looker/Vertex AI/BI Tools]
When to use: This is your default pattern for almost any data platform. It's battle-tested, scalable, and gives you reprocessing capability.
When to avoid: Simple use cases where raw data can be queried directly. If you only need basic reporting on a single source, the Medallion pattern is overkill.
Streaming Data Pipeline with Pub/Sub + Dataflow + BigQuery
Real-time analytics is one of GCP's strongest use cases. The combination of Pub/Sub, Dataflow, and BigQuery delivers sub-second latency at scale.
Example Diagram
- Ingestion: Events flow into Pub/Sub topics. Pub/Sub decouples producers from consumers and can handle millions of messages per second.
- Processing: Dataflow streaming pipelines read from Pub/Sub, perform transformations (cleansing, enrichment, windowing), and write to BigQuery.
- Storage: BigQuery serves as the analytics engine. Streamed data lands in staging tables, then is merged into production tables.
- Orchestration: Cloud Composer schedules batch jobs for reprocessing and data quality checks.
A real-world example: A healthcare monitoring pipeline that processes patient vitals in real-time, applies risk scoring, and delivers structured insights using the Medallion architecture (Bronze → Silver → Gold). The same pattern works for IoT telemetry, clickstream analytics, and fraud detection.
Diagram structure:
[Event Producers] → Pub/Sub → Dataflow (streaming) → BigQuery (staging)
                                                           ↓
                                                [Gold Tables]
                                                           ↓
                                                [Looker/APIs]
The Streaming vs. Batch Decision
Dataflow supports both stream and batch. Streaming pipelines have higher operational complexity, you're monitoring throughput, dealing with exactly-once semantics, and managing watermarks. If your use case doesn't require sub-second latency, batch processing with scheduled Dataflow jobs is simpler and cheaper.
Dead-Letter Queues (DLQs)
Messages that can't be processed, schema mismatches, malformed data, consumer bugs, need somewhere to go. Always configure a DLQ in Pub/Sub and monitor its depth. A growing DLQ is a sign of a problem you need to fix before data loss occurs.
Batch ETL/ELT Pipeline with Cloud Storage + Dataflow + BigQuery
Not every pipeline needs to be real-time. Batch processing is often the right choice for cost and simplicity.
Example Diagram
- Landing: Batch data lands in Cloud Storage raw zones.
- Processing: Dataflow batch jobs read from Cloud Storage, perform transformations, and load into BigQuery.
- Orchestration: Cloud Composer schedules and coordinates the entire workflow.
- Storage: BigQuery stores the processed data. Use partitioning and clustering for performance and cost control.
Diagram structure:
[Batch Sources] → Cloud Storage (raw) → Dataflow (batch) → BigQuery
                                                              ↑
                                                    [Cloud Composer orchestrates]
When to Use Batch
Batch is the right choice for:
- Data that doesn't need real-time freshness (daily or hourly updates)
- Large historical backfills
- Complex transformations that are easier to reason about in batch
- Cost-sensitive workloads where streaming would be overkill
Data Lakehouse with BigLake + Apache Iceberg
The lakehouse combines the flexibility of data lakes with the performance of data warehouses. BigLake is GCP's implementation, letting you query open-format files in Cloud Storage with BigQuery's engine.
Example Diagram
- Storage: Apache Iceberg tables in Cloud Storage serve as the primary storage format.
- Query: BigLake tables in BigQuery provide a SQL interface to Iceberg data.
- Processing: Dataflow and Dataproc (managed Spark) read and write Iceberg tables.
- Governance: Dataplex and Data Catalog provide unified governance across formats.
Diagram structure:
[Data Sources] → Dataflow/Dataproc → Cloud Storage (Iceberg tables)
                                         ↓
                                    BigLake (BigQuery)
                                         ↓
                                    [Looker/Vertex AI]
When to Use Lakehouse
Lakehouse is ideal for:
- Teams that need both SQL analytics and file-based processing (Spark, Python)
- Open-format requirements (avoiding vendor lock-in)
- Multi-engine workloads where different teams use different tools on the same data
When to Avoid
If your primary consumption is SQL-based analytics, BigQuery-native tables are simpler and perform better. Lakehouse adds complexity, use it only when you need the flexibility.
Data Mesh Architecture
Data Mesh is an organizational and architectural framework that treats data as a product. It's not about technology, it's about how teams organize around data.
Example Diagram
In a GCP Data Mesh implementation:
- Data domains (e.g., Sales, Inventory, Customer) own their data products
- Core services provide governance, discoverability, and access controls
- Data Catalog serves as the single pane of glass for discovery
- Interfaces include BigQuery datasets, Cloud Storage buckets, Pub/Sub topics
Diagram structure:
                    [Core Services: Data Catalog + IAM + Governance]
                                        ↓
    ┌───────────────────┼───────────────────┐
    ↓                   ↓                   ↓
[Sales Domain]   [Inventory Domain]   [Customer Domain]
    ↓                   ↓                   ↓
[Data Products]  [Data Products]     [Data Products]
    ↓                   ↓                   ↓
    └───────────────────┼───────────────────┘
                        ↓
                [Consumption Layer]
When to Use Data Mesh
Data Mesh is the right choice for large organizations with multiple independent teams that need to share data while maintaining autonomy. It's not a pattern you adopt lightly, it requires organizational change.
When to Avoid
For small teams or single-domain data platforms, Data Mesh is unnecessary complexity. Start with a centralized data platform and evolve to Data Mesh only when the organization grows beyond what centralized governance can handle.
GCP Data Platform Reference Architecture
A complete GCP data platform brings all these patterns together.
Example Diagram
- Data Sources: Operational databases (Cloud SQL, on-prem RDBMS), SaaS applications (ERP, CRM), streaming events (IoT, web/mobile apps)
- Ingestion & Storage: Cloud Storage for raw data landing; Pub/Sub for real-time messaging
- Processing & Transformation: Dataflow for both batch and streaming; Cloud Composer for orchestration
- Data Warehousing & Analytics: BigQuery as the enterprise data warehouse with optimized tables and data marts
- Consumption: Looker/Tableau/Power BI for dashboards; Vertex AI for ML; custom applications via APIs
Diagram structure:
[Data Sources] → [Ingestion: Cloud Storage + Pub/Sub]
                        ↓
              [Processing: Dataflow + Cloud Composer]
                        ↓
              [Storage: BigQuery + Cloud Storage]
                        ↓
         [Consumption: Looker + Vertex AI + APIs]
When to Use This Pattern: This is your starting point for any serious data platform. It's comprehensive, scalable, and follows GCP best practices.
When Not to Use It: If you have a single data source and simple reporting needs, this pattern is overkill. Start small and add components as requirements grow.
Decision Framework: Which Pattern Should You Use?
| Your Primary Requirement | Recommended Pattern | Key Services |
|---|---|---|
| Batch ETL/ELT | Medallion + Batch Dataflow | Cloud Storage, Dataflow, BigQuery, Cloud Composer |
| Real-time analytics | Streaming Pipeline | Pub/Sub, Dataflow, BigQuery |
| Multi-engine workloads | Lakehouse | Cloud Storage (Iceberg), BigLake, Dataflow, Dataproc |
| Large org with multiple teams | Data Mesh | Data Catalog, Dataplex, Domain-owned data products |
| Complete enterprise platform | Reference Platform | All of the above, integrated |
Common Data Architecture Mistakes
Mistake 1: Skipping the Bronze layer. Without raw data storage, you can't reprocess when requirements change. Always keep the original data.
Mistake 2: Not using partitioning and clustering. Unoptimized BigQuery tables cost a fortune and run slowly. Partition by date; cluster by frequently filtered columns.
Mistake 3: Ignoring data governance. No governance = data swamp. Dataplex and Data Catalog aren't optional at scale.
Mistake 4: Over-engineering for real-time. Most workloads don't need sub-second latency. Batch is simpler, cheaper, and easier to debug.
Mistake 5: Forgetting about cost. BigQuery charges for bytes scanned, storage, and streaming inserts. Design with cost in mind, use partitioning, clustering, and materialized views.
Mistake 6: No dead-letter queues. Failed messages block pipelines. Always configure DLQs and monitor them.
Tools for Visualizing GCP Data Architecture Diagrams
Creating these diagrams manually is time-consuming. Several tools can help:
AI Line Studio generates Google Cloud architecture diagrams from natural language descriptions in 15-20 seconds, supporting 3,000+ officially licensed Google Cloud icons. For rapid iteration during design sessions, the AI cloud diagram generator lets you refine descriptions and regenerate instantly. You can also build production-ready diagrams with the AI architecture diagram builder and reuse them as templates. The GCP data architecture diagram workspace provides editable templates with official GCP icons for common data platform patterns, while the AI system architecture generator creates complete Google Cloud system architecture diagrams for enterprise, AI, microservices, and cloud-native workloads.
The tool exports animated diagrams (GIF, MP4) for presentations and training material. However, it's an early-stage product with a smaller install base, and complex descriptions may require manual cleanup, it's not a zero-review tool for mission-critical documentation.
MockFlow IdeaBoard generates GCP data architecture diagrams from text prompts with official icons.
Lucidchart offers GCP shape libraries and templates for data pipelines.
Miro provides collaborative whiteboarding for data architecture design.
For documentation-as-code workflows, Mermaid.js and PlantUML are solid open-source options.
External Resources
- Google Cloud Architecture Center, reference architectures, design guidance, and best practices
- Google Cloud BigQuery Documentation, complete BigQuery reference
- Google Cloud Dataflow Documentation, stream and batch processing guidance
- Google Cloud Lakehouse Documentation, BigLake and open format storage
- Google Cloud Data Mesh Whitepaper, in-depth Data Mesh guidance on GCP
- Apache Iceberg on Google Cloud, getting started with Iceberg on GCP
Final Thoughts
GCP data architecture diagrams are more than documentation, they're the blueprint for how your organization turns data into insight. Start with the Medallion pattern (Bronze → Silver → Gold) for most workloads. Add streaming when you need real-time. Consider the lakehouse when you need open formats. Evolve to Data Mesh only when your organization's scale demands it.
The best data architecture is the one that delivers reliable, timely data to the people who need it, at a cost you can justify. Start simple, validate with real data, and iterate. And always, always draw the diagram first.