
High-Level AWS Architecture Diagram: A Complete Guide to Enterprise Cloud Design
A high-level AWS architecture diagram is the single most important piece of documentation you can create for any cloud system. It provides a bird's-eye view of your entire infrastructure, showing service relationships, infrastructure boundaries, and core data flows in one consolidated view.
Unlike detailed implementation diagrams that dive into specific service configurations, a high-level diagram abstracts away the noise. It answers the question: "What does this system do, and how do its major parts fit together?", without forcing anyone to wade through 50 service icons and 80 arrows.
This guide walks through what makes a high-level AWS architecture diagram effective, how to create one, and the best practices that separate professional diagrams from confusing messes.
Cloud Architecture
Create cloud architecture diagrams for AWS, Azure, GCP, and more. Design scalable infrastructure with professional cloud icons.
Complete guide to high-level AWS architecture diagrams, what to include, common patterns, best practices, and tools for enterprise cloud design.
Click Cloud Architecture to open AI Line Studio and generate diagrams from natural language in seconds.
What Is a High-Level AWS Architecture Diagram?
A high-level AWS architecture diagram is a visual representation of a cloud system that focuses on the major components and their relationships rather than implementation details. It shows how AWS services, compute, storage, databases, networking, and security controls, are organized and connected to support an application or workload.
- The main AWS services in use
- Network boundaries (VPCs, subnets, Availability Zones)
- User entry points (CloudFront, API Gateway, Load Balancers)
- Core data or request flow
- High-level security boundaries
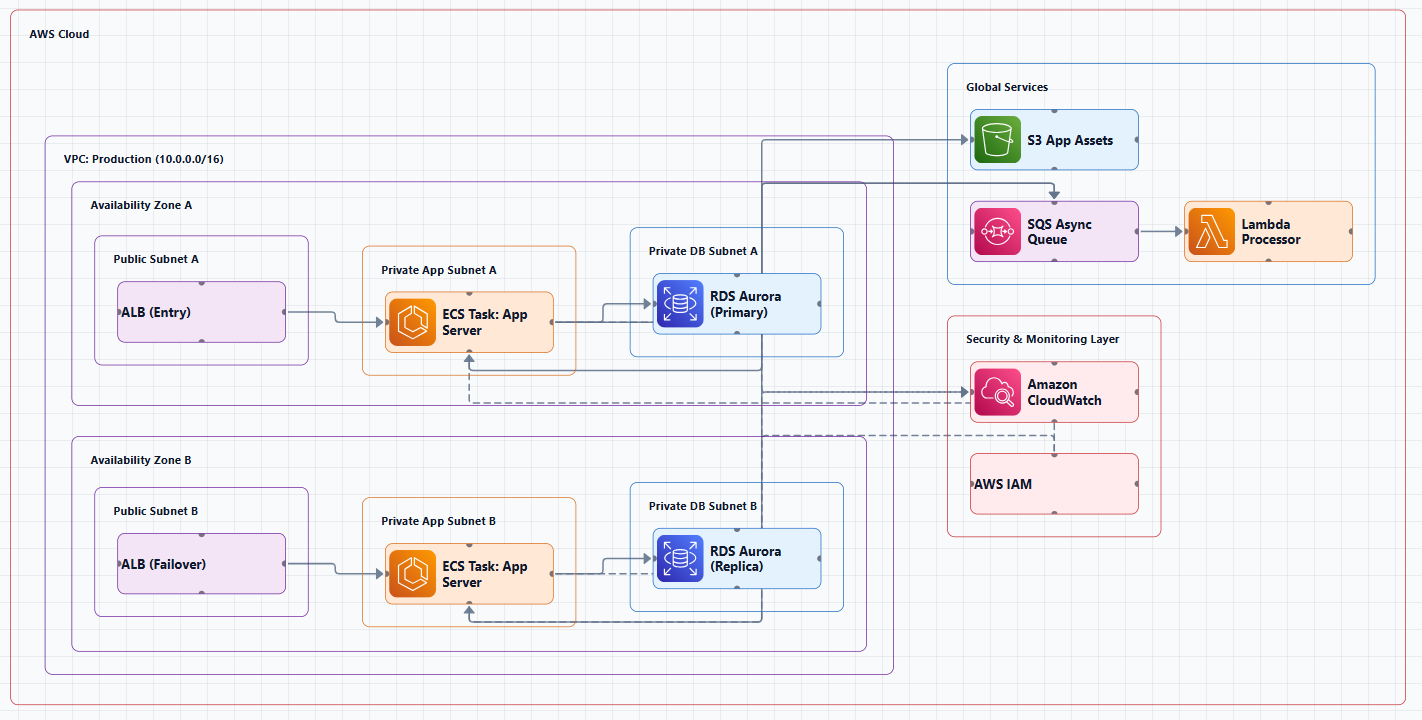
What it includes:
What it excludes:
- Specific instance types or sizes
- Detailed configuration parameters
- Internal component architecture (that's for lower-level diagrams)
- Every single dependency or integration
A strong AWS architecture diagram should include the main services, network boundaries, user entry points, and the core data or request flow. It should also show how application services, databases, load balancing, storage, permissions, and monitoring connect, so engineers can understand deployment logic without filling in missing system relationships themselves.
Why High-Level Diagrams Matter
For technical teams, high-level diagrams support collaboration by making relationships visible. You can quickly see how traffic enters the system, which services depend on each other, and where scaling or redundancy has been built in. This makes it easier to identify bottlenecks, security gaps, and performance risks before they surface in production.
For non-engineering stakeholders, diagrams translate complex cloud systems into intuitive visuals. A well-structured diagram explains system behavior without requiring deep knowledge of cloud internals. This is especially useful during reviews, audits, and planning discussions where alignment matters more than implementation detail.
For documentation, a high-level architecture diagram is usually the best starting point for AWS system documentation. Teams often add sequence, network, or deployment diagrams later when they need to explain traffic flow, environment setup, troubleshooting paths, or failover logic in more detail.
Key Components of a High-Level AWS Diagram
Every effective high-level AWS architecture diagram should include these core elements:
1. User Entry Points
Show how users or external systems interact with your application. This typically includes:
- Amazon CloudFront, CDN for global content delivery
- Amazon Route 53, DNS and traffic routing
- Application Load Balancer (ALB), Distributes incoming traffic
2. Compute Layer
The processing power behind your application:
- EC2 instances or Auto Scaling Groups
- ECS/EKS clusters for containerized workloads
- AWS Lambda for serverless compute
3. Application Services
The business logic and middleware:
- API Gateway for API management
- Microservices (if applicable)
- Message queues (SQS, SNS) and event buses (EventBridge)
4. Data Layer
Where your data lives:
- Amazon RDS, Managed relational databases
- Amazon DynamoDB, NoSQL database
- Amazon S3, Object storage for static assets and data lakes
- Amazon ElastiCache, In-memory caching
5. Network Boundaries
The security and organizational structure:
- VPC with CIDR block
- Public and private subnets
- Availability Zones (show at least two for high availability)
- Internet Gateway and NAT Gateways
6. Security and Management
The overlay that protects and monitors everything:
- IAM, Identity and access management
- Security Groups and Network ACLs
- CloudWatch, Monitoring and logging
- AWS WAF, Web Application Firewall
High-Level Architecture Patterns
Here are ready-to-use high-level patterns for common AWS architectures. Use these as starting points.
Pattern 1: Serverless Web Application
Services: CloudFront → API Gateway → Lambda → DynamoDB, with S3 for static assets and Cognito for auth
Layout (left to right): Users → CloudFront → S3 Bucket (static) → API Gateway → Lambda → DynamoDB
When to use: Event-driven workloads, sporadic traffic, applications with unpredictable scaling needs, or teams that want to focus on code rather than infrastructure.
Key differentiator: No servers to manage. Every component scales automatically. You pay only for what you use.
Pattern 2: VPC with Public and Private Subnets
Layout (nested groups): AWS Cloud → Region → VPC → AZ-1 (Public Subnet with NAT Gateway and ALB, Private Subnet with EC2/ECS and RDS primary) and AZ-2 (Public Subnet with NAT Gateway, Private Subnet with EC2/ECS and RDS standby)
When to use: Foundational network architecture for most AWS deployments. Separates web tier (public) from application and database tiers (private).
Key differentiator: Security through isolation. The public/private split ensures application servers and databases are not directly exposed to the internet.
Pattern 3: Three-Tier Architecture
Services: Users → Internet Gateway → ALB → Web Servers (public subnet) → Internal ALB → Application Servers (private subnet) → Database (private subnet, across multiple AZs)
When to use: Most production web applications and enterprise systems. Each layer can be developed, scaled, and maintained independently.
Key differentiator: Separation of concerns. You can scale your web servers without touching your database.
Pattern 4: Microservices on ECS/EKS
Layout: Route 53 → CloudFront → ALB → ECS/EKS Cluster. Services communicate with each other. ElastiCache and RDS Aurora connect to services. ECR stores container images. CloudWatch monitors everything
When to use: Organizations adopting microservices where each service can be developed, deployed, and scaled independently.
Key differentiator: Independent service ownership and deployment.
Pattern 5: Data Pipeline / Analytics
Layout (pipeline flow): Data Sources → Kinesis Data Streams (real-time) and S3 (batch) → Processing (Firehose, Glue, Lambda) → Storage (S3 Data Lake, Glue Catalog) → Analytics (Athena, Redshift, QuickSight)
When to use: Data engineering workloads requiring ingestion, processing, and analysis at scale.
Key differentiator: Layered approach separates ingestion, processing, storage, and analytics. Each layer scales independently.
Pattern 6: CI/CD Pipeline
Layout: Developer → CodeCommit → CodePipeline → CodeBuild → S3 (artifacts). CodePipeline then → CodeDeploy (staging) → Manual Approval → CodeDeploy (prod)
When to use: DevOps teams requiring automated deployment pipelines.
Key differentiator: Automates the entire deployment process. Reduces human error. Provides audit trails.
Best Practices for High-Level AWS Architecture Diagrams
1. Keep It Simple and Readable
Focus on the components and relationships that matter for the intended audience. If a diagram has more than 15 to 20 nodes, it's too complex for a high-level view. Split it into multiple diagrams at different abstraction levels.
Sizing guidelines:
- Small diagram (3-5 services): pageWidth=800, pageHeight=600
- Medium diagram (6-12 services): pageWidth=1169, pageHeight=827 (default A3)
- Large diagram (13+ services): pageWidth=1600, pageHeight=1200 minimum
2. Use Official AWS Icons
AWS architecture icons are designed to be simple. Consistent use of official AWS icons makes diagrams easier to read because the visual language is familiar to cloud engineers and architects alike. Use icons from draw.io's built-in mxgraph.aws4 stencil library.
Icon guidelines:
- Icon size: 78x78px for main services, 65x65px for secondary
- Use
sketch=0on all icons andstrokeColor=#ffffffon all AWS service icons - Font size: 12px for labels
- Include the product name somewhere close to the icon
3. Use Directional Arrows
Show the flow of data. Lines without arrows are ambiguous. Always indicate direction.
Edge routing rules:
- Use
edgeStyle=orthogonalEdgeStylefor right-angle connectors - For simple adjacent connections, let draw.io auto-route, do NOT set entry/exit points
- Leave 20px straight segment before target and after source for arrowheads
- Edges leave PERPENDICULAR to the container face and route OUTWARD
4. Emphasize Network Boundaries
Clearly show VPCs, subnets, and security groups. Show security groups and network ACLs. This visually communicates security and organizational structure.
Grouping guidelines:
- 180px horizontal / 120px vertical gaps between service group containers
- Group padding: 30px all sides; children start at y=40, x=20 minimum
- ~20px label height below each 48x48 icon; 60px gap between vertical tiers
- Align all positions to grid multiples of 10
5. Label Everything
Provide clear, accurate labels for each icon. Don't assume readers will recognize an icon. Good labels are short but descriptive: "Web Server (EC2)" not just "EC2".
Edge labels:
- Keep labels SHORT (1-2 words maximum)
- On horizontal edges: position label ABOVE the line
- On vertical edges: position label to the LEFT
- Always add
labelBackgroundColor=#F5F5F5so labels don't overlap lines
6. Include Metadata
Add a title, description, last updated date, author, and version. A diagram without a date is assumed to be outdated.
7. Use Layers
A high-level diagram should use a layered structure that separates compute, storage, networking, and access services. This makes it easier to review service dependencies, traffic paths, scaling logic, and operating boundaries.
8. Validate Against AWS Well-Architected
The AWS Well-Architected Framework provides a structured approach for evaluating cloud architectures against proven best practices. Key pillars to consider:
- Operational Excellence
- Security
- Reliability
- Performance Efficiency
- Cost Optimization
- Sustainability
Common Mistakes to Avoid
Mistake 1: Too much detail. Trying to show everything in one diagram creates visual noise. Save detailed configurations for lower-level diagrams.
Mistake 2: No directional arrows. Lines without arrows are ambiguous. Always show the flow of data.
Mistake 3: No labels. Icons without text labels leave readers guessing. Include product names close to each icon.
Mistake 4: Ignoring security boundaries. Not showing VPCs, subnets, or security groups misses a critical part of the architecture story.
Mistake 5: Outdated diagrams. A diagram without a last-updated date is assumed to be wrong. Include metadata and update regularly.
Mistake 6: Inconsistent styling. Different arrow styles, icon sizes, or colors for similar elements confuse readers. Standardize across all your diagrams.
Tools for Creating High-Level AWS Architecture Diagrams
Manual Tools
Draw.io (diagrams.net): Free, browser-based, includes AWS shape libraries and templates. No registration required.
Lucidchart: Professional diagramming with AWS-specific templates, real-time collaboration, and revision history.
Visual Paradigm Online: Free online diagramming software with AWS Architecture Diagram support.
AI-Powered Tools
AI-powered tools are fundamentally changing how you create high-level diagrams. Instead of dragging boxes, you describe your architecture in natural language, and the tool generates a professional diagram.
AI Line Studio takes this prompt-first approach. Describe your system, "a 3-tier web app on AWS with EC2, RDS, and CloudFront", and it generates a structured high-level diagram with official AWS icons in 15 to 20 seconds. For AWS-specific workflows, the dedicated AI cloud diagram generator turns descriptions into production-ready visuals. The AI architecture diagram builder helps build and refine high-level diagrams into production-ready designs.
Visual Paradigm AI asks technical questions to build a real stack rather than randomly placing icons, supporting High Availability and Multi-Region strategies.
Kiro CLI with MCP enables generative AI to create architecture diagrams using natural language prompts, with access to the complete AWS icon set and architectural best practices.
Infrastructure as Code Tools
Terravision automatically converts Terraform code into architecture diagrams using official AWS icons.
terraformgraph generates interactive architecture diagrams from Terraform configurations, supporting 100+ AWS resource types.
Step-by-Step: Creating a High-Level AWS Architecture Diagram
Step 1: Define Your Audience and Scope
Ask yourself: Who is this diagram for, and what do they need to understand?
- For stakeholders: Keep it high-level, show the main components and data flow
- For technical teams: Show more detail, specific services and boundaries
- For yourself: Focus on what you're trying to design or document
Step 2: List Your Major Components
Write down every major AWS service in your system. Then cut the list in half. For a high-level diagram, you probably only need the 5 to 10 most important services.
Step 3: Group by Logical Boundaries
Group components by:
- Tier: Web, application, data
- Network: VPC, subnet, security group
- Responsibility: Compute, storage, networking
Step 4: Draw the Connections
Add directional arrows to show how data flows between components:
- Where does traffic enter the system?
- Which services call which other services?
- Where does data get stored?
Step 5: Label Everything
Every icon should have a clear, descriptive label. Don't assume readers will recognize an icon.
Step 6: Add Metadata
Include a title, description, last updated date, author, and version.
Step 7: Review and Refine
Validate your diagram against the AWS Well-Architected Framework. Check that security boundaries, data flows, and service dependencies are accurately represented.
Summary
A high-level AWS architecture diagram is the foundation of effective cloud documentation. It provides a bird's-eye view of your entire infrastructure, showing service relationships and infrastructure boundaries in one view.
Key takeaways:
- Focus on major components and their relationships, not implementation details
- Use official AWS icons consistently
- Show directional data flow with arrows
- Emphasize network boundaries (VPCs, subnets, security groups)
- Label everything clearly
- Include metadata (title, date, author)
- Validate against AWS Well-Architected best practices
- Keep it simple, if it has more than 15 to 20 nodes, it's too detailed for a high-level view
Common architecture patterns serve as templates to reduce design time and support consistency across systems. Start with one of the patterns in this guide, serverless web app, three-tier, microservices, data pipeline, or CI/CD, and adapt it to your needs.
To start creating your own high-level AWS architecture diagrams, explore the high level AWS architecture diagram tool for templates and practical examples. For automated diagram generation, the AI cloud diagram generator turns descriptions into visuals instantly. For end-to-end system architecture beyond AWS, the AI system architecture generator covers distributed and enterprise system designs.