
Sample AWS Architecture Diagrams: Real-World Examples for Every Workload
AWS architecture diagrams are the visual language of cloud infrastructure. They communicate how systems are built, how data flows, and where security boundaries exist. But staring at a blank canvas is never easy, especially when you're designing something new.
The best way to learn AWS architecture is to study real samples. This guide presents production-ready sample AWS architecture diagrams for the most common workloads, with detailed explanations of what each component does and why it's designed that way.
Cloud Architecture
Create cloud architecture diagrams for AWS, Azure, GCP, and more. Design scalable infrastructure with professional cloud icons.
Sample AWS architecture diagrams for serverless, VPC, three-tier, microservices, data pipelines, CI/CD, multi-region, hybrid, and SaaS workloads.
Click Cloud Architecture to open AI Line Studio and generate diagrams from natural language in seconds.
What Is a Sample AWS Architecture Diagram?
A sample AWS architecture diagram is a visual representation of a system built on Amazon Web Services. It shows how AWS services, compute, storage, databases, networking, and security controls, are organized and connected to support an application or workload.
- CloudFront: Content delivery network for static assets and API routing
- S3: Stores static website files (HTML, CSS, JavaScript)
- API Gateway: REST API endpoint that triggers Lambda functions
- Lambda: Serverless compute that runs application logic
- DynamoDB: NoSQL database for storing application data
- Cognito: User authentication and authorization
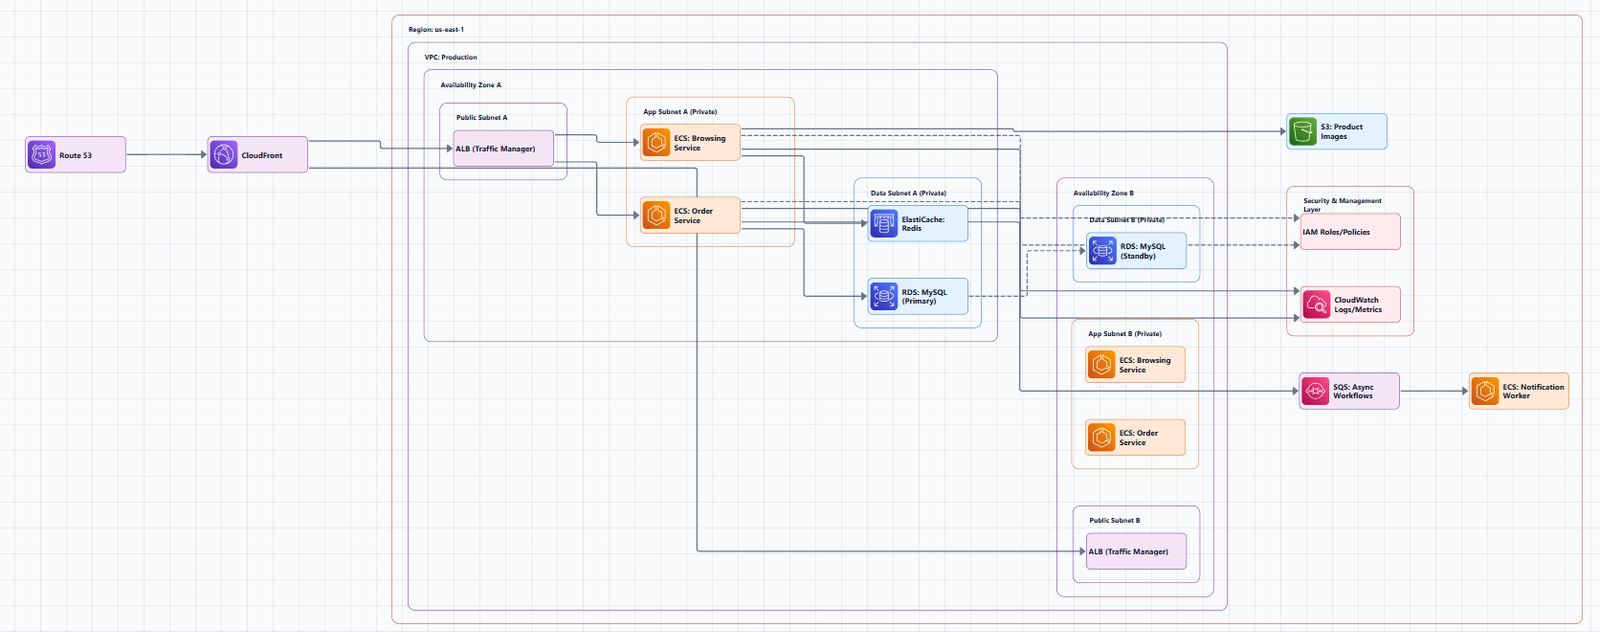
A strong AWS architecture diagram should include the main services, network boundaries, user entry points, and the core data or request flow. These samples serve as starting points you can adapt for your own projects.
Sample 1: Serverless Web Application
This is the modern standard for building web applications without managing servers.
Services shown:
Layout (left to right): Users → CloudFront → S3 Bucket (static) → API Gateway → Lambda → DynamoDB. Cognito connects to API Gateway for authentication.
Why this works: Every component scales automatically. You pay only for what you use. No servers to patch or maintain. A fully serverless application can cost exactly $0 while sitting idle and scale instantly to meet demand.
When NOT to use this: Long-running processes (Lambda has a 15-minute timeout), heavy computation, or applications with predictable, sustained traffic where reserved instances would be cheaper.
Sample 2: VPC with Public and Private Subnets
This is the foundational network architecture for most AWS deployments. It shows how to securely isolate different tiers of an application across multiple Availability Zones.
Services shown:
- VPC: The virtual network, defined with a CIDR block (e.g., 10.0.0.0/16)
- Public subnets: Contain resources that need internet access (load balancers, NAT gateways)
- Private subnets: Contain resources that should not have direct internet access (application servers, databases)
- Availability Zones: Multiple AZs for high availability
- Internet Gateway: The entry point for internet traffic
- Application Load Balancer (ALB): Distributes traffic across application servers
- EC2/ECS instances: Compute resources running the application
- RDS: Managed database with a primary instance in one AZ and a standby replica in another AZ
Layout (nested groups): AWS Cloud → Region → VPC 10.0.0.0/16 → AZ-1 (Public Subnet 10.0.1.0/24 with NAT Gateway and ALB, Private Subnet 10.0.2.0/24 with EC2/ECS and RDS primary) and AZ-2 (Public Subnet 10.0.3.0/24 with NAT Gateway, Private Subnet 10.0.4.0/24 with EC2/ECS and RDS standby). Users → Internet Gateway → ALB → EC2/ECS.
Why this works: The public/private split provides security, your application servers and database are not directly exposed to the internet. The multi-AZ setup provides high availability, if one AZ fails, traffic routes to the other.
Security Groups act as virtual firewalls, controlling inbound and outbound traffic to each component:
- The ALB's Security Group ensures only HTTP/HTTPS traffic is allowed from the internet
- The web servers' Security Group only accepts traffic from the ALB
When NOT to use this: For simple, single-server applications where the overhead of VPC design isn't justified. For serverless architectures that don't use VPC resources.
Sample 3: Three-Tier Web Application Architecture
The three-tier architecture is the most common pattern for production web applications. It separates an application into three logical layers: presentation (web), application (logic), and database.
Services shown:
- Presentation Tier (Web Layer): Users interact with this, serves the frontend. Hosted on EC2 instances in Auto Scaling groups behind an Application Load Balancer.
- Application Tier (Logic Layer): Where business logic runs, processes API requests. Hosted on EC2 instances in private subnets.
- Database Tier (Data Layer): Where data is stored. Amazon RDS with Multi-AZ deployment for high availability.
Why this works: Each layer can be developed, scaled, and maintained independently. You can scale your web servers without touching your database. You can update your application logic without redeploying your web servers. The multi-AZ deployment provides high availability and automatic failover.
When NOT to use this: For simple applications where the operational overhead of managing three tiers isn't justified.
Sample 4: Microservices on ECS/EKS
For organizations adopting microservices, this architecture deploys and manages containerized services independently.
Services shown:
- Route 53: DNS and traffic routing
- CloudFront: CDN for global delivery
- Application Load Balancer (ALB): Distributes incoming traffic to services
- ECS/EKS Cluster: Container orchestration platform
- Multiple services: Each service runs independently (Service A, Service B, Service C)
- ElastiCache: In-memory caching for performance
- RDS Aurora: Managed relational database
- ECR: Container image registry
- CloudWatch: Monitoring all services
Layout: Route 53 → CloudFront → ALB → ECS/EKS Cluster. Services communicate with each other (Service A ↔ Service B ↔ Service C). ElastiCache and RDS Aurora connect to the services. ECR stores container images. CloudWatch monitors everything.
Why this works: Each service can be developed, deployed, and scaled independently. Teams can own individual services.
When NOT to use this: For small applications where the operational overhead of microservices outweighs the benefits. For teams without strong DevOps practices.
Sample 5: Data Pipeline / Analytics
For data engineering workloads, this architecture shows how to ingest, process, and analyze data at scale.
Services shown:
- Data Sources: External data streams and batch uploads
- Kinesis Data Streams: Real-time data ingestion
- S3: Data lake storage with multiple layers, raw, processed, curated
- Kinesis Data Firehose: Loads streaming data into S3
- Glue ETL Jobs: Transforms and prepares data
- Lambda: Real-time data transformations
- Glue Data Catalog: Metadata management
- Athena: Serverless query service for S3 data
- Redshift: Data warehouse for analytics
- QuickSight: Business intelligence dashboards
- Lake Formation: Data governance and access control
Layout (pipeline flow): Data Sources → Kinesis Data Streams (real-time) and S3 Bucket (raw, batch) → Processing (Kinesis Data Firehose → S3 processed, Glue ETL Jobs → S3 curated, Lambda for real-time transforms) → Storage (S3 Data Lake, Glue Data Catalog) → Analytics (Athena queries S3, Redshift warehouse, QuickSight dashboards).
Why this works: The layered approach separates ingestion, processing, storage, and analytics. Each layer can scale independently. Serverless services (Lambda, Athena, Glue) mean you pay only for what you use.
Sample 6: CI/CD Pipeline
For DevOps teams, this architecture shows an automated deployment pipeline.
Services shown:
- Developer: Code commits trigger the pipeline
- CodeCommit: Source code repository
- CodePipeline: Orchestrates the entire build, test, and deploy process
- CodeBuild: Compiles code and runs tests
- S3: Stores build artifacts
- CodeDeploy: Deploys to staging and production environments
- ECR: Container image registry (for container-based deployments)
- CloudWatch: Monitoring
- SNS: Notifications for pipeline events
Layout (pipeline stages): Developer → CodeCommit → CodePipeline → CodeBuild → S3 (artifacts). CodePipeline then → CodeDeploy (staging) → Manual Approval → CodeDeploy (prod).
Why this works: Automates the entire deployment process. Reduces human error. Provides audit trails of every deployment. Manual approval gates allow human review before production deployment.
Sample 7: Multi-Region Active-Active Architecture
For applications requiring global availability and disaster recovery.
Layout (two regions side by side): Route 53 (latency-based routing) at top. Region 1 (us-east-1) and Region 2 (eu-west-1) each have CloudFront, ALB, and ECS/Lambda compute. Aurora primary in Region 1 replicates to Aurora replica in Region 2. DynamoDB Global Table syncs across regions. S3 replication keeps storage synchronized. Global Accelerator optionally at top for improved performance.
Why this works: Provides geographic redundancy. If one region fails, Route 53 routes traffic to the healthy region. Low latency for global users.
Sample 8: Hybrid Architecture (On-Premises + AWS)
For organizations extending existing on-premises infrastructure to the cloud.
Layout: Corporate Data Center with Traditional Server, Database, and Active Directory connects to AWS Cloud via Direct Connect or Site-to-Site VPN. Traffic flows through Transit Gateway to multiple VPCs: Production VPC (workloads), Shared Services VPC (Directory Service, Systems Manager), and Development VPC (workloads).
Why this works: Extends existing on-premises investments to the cloud. Provides secure, private connectivity. Allows gradual migration.
Sample 9: Serverless SaaS Architecture
For multi-tenant software-as-a-service applications on AWS.
Services shown:
- S3: Hosts web application (React, Angular, etc.)
- Cognito: SaaS identity provider
- API Gateway: Orchestrates microservices, validates tenant tokens (via Lambda authorizer), maps requests, manages SLAs
- Lambda: Microservices implementing multi-tenant business logic
- Microservices: Each encapsulates its own data, a database cannot be shared by two microservices
- Shared Services: Onboarding, management, and tenant operations
Why this works: Serverless model simplifies scaling and operational footprint. Each microservice owns its data, enabling tenant isolation choices (silo or pool per service).
Best Practices for Creating AWS Architecture Diagrams
1. Keep Diagrams Simple and Readable
Focus on the components and relationships that matter for the intended audience. If a diagram has more than 15 to 20 nodes, it's too complex. Split it into multiple diagrams at different abstraction levels.
2. Use Official AWS Icons
AWS architecture icons are designed to be simple. Consistent use of official AWS icons makes diagrams easier to read because the visual language is familiar to cloud engineers and architects.
3. Use Directional Arrows
Show the flow of data. Lines without arrows are ambiguous. Always indicate direction.
4. Emphasize Network Boundaries
Clearly show VPCs, subnets, and security groups. This visually communicates security and organizational structure.
5. Label Everything
Provide clear, accurate labels for each icon. Don't assume readers will recognize an icon.
6. Include Metadata
Add a title, description, last updated date, author, and version. A diagram without a date is assumed to be outdated.
7. Follow Sizing Guidelines
- Small diagram (3-5 services): pageWidth=800, pageHeight=600
- Medium diagram (6-12 services): pageWidth=1169, pageHeight=827 (default A3)
- Large diagram (13+ services): pageWidth=1600, pageHeight=1200
- Multi-region: pageWidth=2000, pageHeight=1000
8. Validate Against AWS Well-Architected
The architecture diagram above is an example of a solution created with Well-Architected best practices in mind. The AWS Well-Architected Framework consists of six pillars: Operational Excellence, Security, Reliability, Performance Efficiency, Cost Optimization, and Sustainability.
Tools for Creating Sample AWS Architecture Diagrams
Manual Tools
- Draw.io (diagrams.net): Free, browser-based, includes AWS shape libraries and templates. No registration required.
- Lucidchart: Professional diagramming with AWS-specific templates and real-time collaboration.
- Visual Paradigm Online: Free online diagramming software with AWS Architecture Diagram support.
AI-Powered Tools
AI-powered tools let you describe your architecture in plain language and get a diagram in seconds, no manual dragging required.
AI Line Studio takes this prompt-first approach with AWS support. Describe your system, "a 3-tier web app on AWS with EC2, RDS, and CloudFront", and it generates a structured diagram with official AWS icons in 15 to 20 seconds. The output supports PNG, GIF, and MP4 exports, plus shareable documentation links. For AWS-specific workflows, the dedicated AI cloud diagram generator turns AWS descriptions into production-ready visuals. If you're working across multiple providers, the AI architecture diagram builder covers AWS, Azure, GCP, and OCI with over 3,000 officially licensed icons.
The honest limitation: AI Line Studio is an early-stage product with a smaller install base and fewer third-party integrations than established tools. It's not a general-purpose diagramming tool, if you need org charts, mind maps, or non-technical diagrams, a broader tool is a better fit. And as with any AI-generated output, complex or ambiguous system descriptions may need manual cleanup. It's not a zero-review tool for mission-critical documentation.
Live Infrastructure Scanners
Workload Discovery on AWS builds architecture diagrams using near real-time data, scanning your accounts every 15 minutes to ensure diagrams are accurate and current.
Summary
Sample AWS architecture diagrams are essential for understanding cloud design patterns. The samples in this guide, serverless web apps, VPC designs, three-tier architectures, microservices, data pipelines, CI/CD, multi-region, hybrid, and serverless SaaS, represent the most common patterns across AWS workloads.
Key takeaways:
- A strong AWS architecture diagram includes main services, network boundaries, user entry points, and core data flow
- Common patterns serve as templates to reduce design time and support consistency
- Best practices: keep it simple, use official icons, show directional arrows, label everything, emphasize network boundaries
- Validate against the AWS Well-Architected Framework
- An outdated diagram is worse than none, keep diagrams updated
If you're ready to create your own AWS architecture diagrams, explore the AWS architecture diagram tool for templates and practical examples. For automated diagram generation, the AI cloud diagram generator turns AWS descriptions into visuals instantly. For end-to-end system architecture beyond AWS, the AI system architecture generator covers distributed and enterprise system designs.