
Simple Azure Architecture Diagram: A Beginner’s Guide to Cloud Blueprints
A simple Azure architecture diagram is a visual representation of a cloud solution built on Microsoft Azure. It uses standardized icons and connectors to show the main components of a system, like web apps, databases, and networks, and how they connect.
This guide covers what a simple Azure architecture is, a common example, core components, best practices, and the tools you can use to create your own.
Cloud Architecture
Create cloud architecture diagrams for AWS, Azure, GCP, and more. Design scalable infrastructure with professional cloud icons.
Learn what a simple Azure architecture diagram is, core services, a basic App Service + SQL example, best practices, and tools for beginners.
Click Cloud Architecture to open AI Line Studio and generate diagrams from natural language in seconds.
What Is a Simple Azure Architecture Diagram?
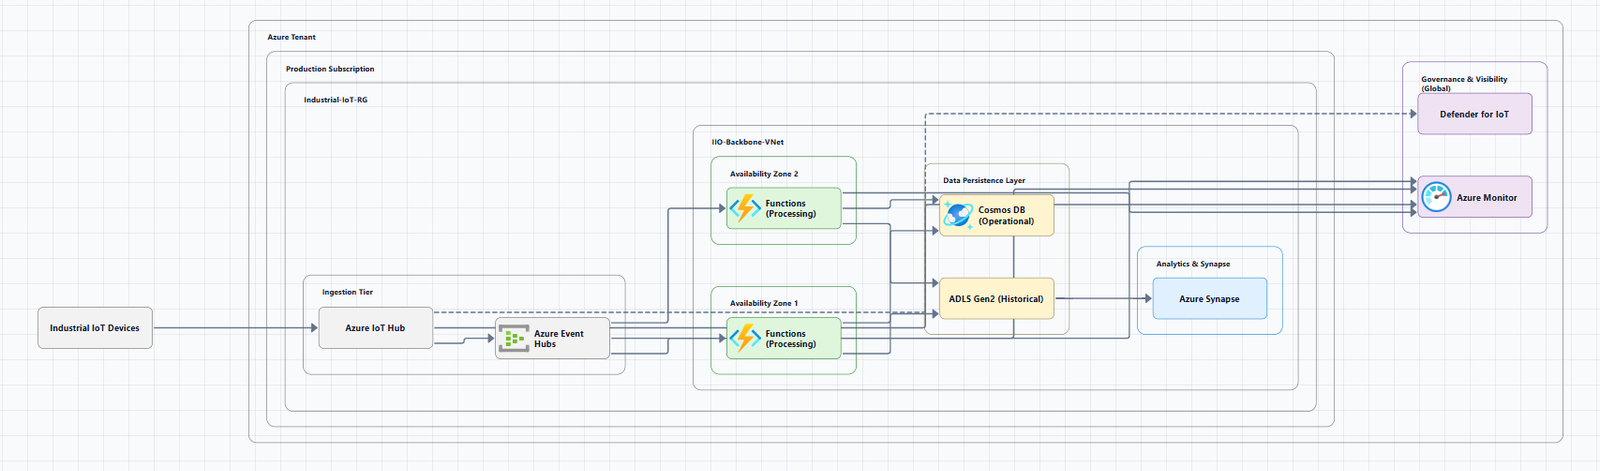
At its core, an Azure architecture diagram answers fundamental questions:
- What services are involved? (e.g., a web app, a database, a load balancer)
- How do they relate? within a solution
- Where does data flow? between components
A simple diagram focuses on the main components and data flow, avoiding unnecessary detail. The goal isn't to show everything, it's to show enough so that anyone looking at the diagram understands the system's structure and how it works.
Architects often communicate through diagrams. Well-designed visuals are powerful tools that help implementers, security reviewers, and business stakeholders converge on a shared mental model, expose risks earlier, and reduce rework.
Why Simple Diagrams Matter
- Learning: Simple diagrams explain core Azure services and cloud architecture concepts without overwhelming beginners.
- Planning: They help design cloud-based services by visualizing how different services, applications, and network components communicate.
- Documentation: They ensure everyone in the organization understands the architecture.
- Presentations: They provide a high-level view for stakeholders to understand how services are connected and secured.
Example: Basic Web Application Architecture
The most common example of a simple Azure architecture is the Basic Web Application, an introductory architecture for learning about running web applications on Azure App Service in a single region.
Important: This architecture isn't meant to be used for production applications. It's an introductory setup for learning and proof-of-concept (POC) purposes.
Architecture Diagram
The architecture consists of four main components:
- Azure App Service: Hosts the web application code.
- Azure SQL Database: Stores the application's relational data.
- Microsoft Entra ID (formerly Azure Active Directory): Provides authentication and authorization.
- Azure Monitor: Collects, analyzes, and acts on telemetry data across your deployment.
Download a Visio file of this architecture: basic-app-service-architecture-flow.vsdx
Workflow
The workflow for this simple architecture is straightforward:
- A user issues an HTTPS request to the App Service's default domain on
azurewebsites.net. - The TLS connection is established from the client directly to App Service. The certificate is managed completely by Azure.
- Easy Auth, a feature of Azure App Service, authenticates the user with Microsoft Entra ID.
- Your application code deployed to App Service handles the request (e.g., connecting to an Azure SQL Database using a connection string configured as an app setting).
- Information about the request and the database call are logged in Application Insights (part of Azure Monitor).
Components
| Component | Purpose |
|---|---|
| Microsoft Entra ID | Cloud-based identity and access management service that provides a single identity control plane to manage permissions and roles for users |
| App Service | A fully managed platform for building, deploying, and scaling web applications |
| Azure Monitor | A monitoring service that collects, analyzes, and acts on telemetry data across your deployment |
| Azure SQL Database | A managed relational database service for relational data |
Core Azure Architecture Components
Understanding these core components is the first step to reading and creating diagrams.
Compute Services
Compute services provide the processing power for your applications:
| Service | Description |
|---|---|
| Azure Virtual Machines | IaaS virtual machines with full OS control |
| Azure App Service | PaaS for hosting web apps, REST APIs, and mobile backends |
| Azure Kubernetes Service (AKS) | Managed Kubernetes for container orchestration |
| Azure Functions | Serverless event-driven compute |
| Azure Container Instances | Serverless containers for simple workloads |
Storage Services
Storage services handle data persistence:
- Azure Blob Storage: Object storage for unstructured data
- Azure Files: Managed file shares
- Azure Disk Storage: Block storage for VMs
- Azure Data Lake Storage: Scalable data lake for analytics
Database Services
Database services manage structured and semi-structured data:
- Azure SQL Database: Managed relational database
- Azure Cosmos DB: Globally distributed NoSQL database
- Azure Database for PostgreSQL/MySQL: Managed open-source databases
- Azure Cache for Redis: In-memory caching
Networking Services
Networking services connect everything together:
- Azure Virtual Network (VNet): Your private network in the cloud
- Subnets: Segments of a VNet's IP address range
- Azure Load Balancer: Distributes traffic across VMs
- Application Gateway: Layer 7 load balancer with WAF
- Azure Front Door: Global load balancer and CDN
- Azure DNS: Domain name resolution
- VPN Gateway and ExpressRoute: Hybrid connectivity
Security and Management Services
Security and management services protect and monitor your infrastructure:
- Microsoft Entra ID: Cloud-based identity and access management
- Azure Key Vault: Secrets, keys, and certificate management
- Azure Monitor: Observability, metrics, and alerts
- Azure Security Center: Security posture management
- Azure Policy: Governance and compliance enforcement
Best Practices for Simple Azure Architecture Diagrams
Microsoft's Azure Well-Architected Framework provides clear guidance on diagramming practices.
1. Use Standard Notations
Use widely recognized symbols, icons, and presentation conventions for good readability and consistent interpretation across different audiences.
2. Use Directional Arrows
Avoid lines without arrows, it's hard to know what the relationship is without direction. Avoid lines with double arrows, they imply a bidirectional dependency. Prefer using a single-ended arrow to represent flow from the dependent (client) to the dependency (server).
3. Label Everything Clearly
Provide clear, accurate, and meaningful labels for each icon, grouping container, and relationship.
4. Maintain Consistency
Use standardized colors, casing, icons, icon sizes, line weights, and arrow heads for similar elements.
5. Be Accurate
While diagrams are abstractions, don't sacrifice accuracy. Inaccuracies can lead to serious miscommunication and implementation delays.
6. Include Metadata
Ensure each diagram contains metadata that provides essential context: title, description, last updated date, author, and version.
7. Use Official Icons
Always use the latest official Azure icons. Microsoft provides an official collection of Azure architecture icons.
8. Keep It Simple
If your diagram has more than 15 to 20 nodes, it's too complex. Split it into multiple diagrams at different abstraction levels.
9. Layer, Don't Overload
Resist the urge to encode every subsystem in a single diagram. Provide progressive disclosure: a context diagram leads to a container diagram, which leads to focused component diagrams.
Tools for Creating Simple Azure Architecture Diagrams
You have several options for creating simple Azure architecture diagrams, from manual tools to AI-powered generators.
Manual Diagramming Tools
Draw.io (diagrams.net):
- Free, browser-based tool with a built-in Azure shape library.
- To enable Azure shapes: click More Shapes > Networking > Azure.
- Several Azure diagram templates are available in the template library: click Arrange > Insert > Template, expand the Cloud section, and select Azure.
Microsoft Visio:
- Includes a dedicated Azure Diagram template with shapes for various Azure services.
- Access via File > New and search for "Azure".
- Many reference architectures in the Azure Architecture Center provide Visio file downloads.
FigJam (by Figma):
- Free collaborative whiteboard tool with official Microsoft Cloud icons.
- Intuitive drag-and-drop capabilities.
- Start with a template to save time.
Lucidchart:
- Offers an Azure (2024) framework template with basic structural elements.
- Access the Azure (2024) shape library.
AI-Powered Tools
AI-powered tools are transforming how architects create diagrams. Instead of dragging boxes, you describe your architecture in natural language, and the tool generates a professional diagram.
- Takes a prompt-first approach, describe a system like "a web app on Azure with App Service, Azure SQL Database, and Azure Front Door" and it generates a structured diagram with official Azure icons in 15 to 20 seconds.
- The output supports PNG, GIF, and MP4 exports, plus shareable documentation links.
- For Azure-specific workflows, you can use the dedicated AI cloud diagram generator.
Azure-DrawIO-MCP:
- A tool that lets you create Microsoft Azure architecture diagrams automatically.
- Write a short description (using GitHub Copilot in Visual Studio Code), and the server turns it into a diagram image.
- Uses the Python
diagramspackage and Azure icons behind the scenes.
MockFlow IdeaBoard:
- Provides an enterprise-level cloud infrastructure diagram example.
- Uses virtual networks, VPN, and ExpressRoute.
- Drag-and-drop icons, editable networks, and custom architecture tools.
Official Azure Icons
The Azure Architecture Center provides an official collection of Azure architecture icons in SVG format.
- Download: Azure Architecture Icons
- Usage: You can drag and drop these SVG files directly into Visio or other diagramming tools.
Common Mistakes to Avoid
Mistake 1: Too much detail. Trying to show everything in one diagram creates visual noise. If your diagram has more than 15 to 20 nodes, it's too complex.
Mistake 2: No labels. Icons without text labels force readers to guess what each service is. Even if you think the icon is obvious, label it anyway.
Mistake 3: No directional arrows. Lines without arrows leave readers guessing about the direction of data flow. Always use directional arrows.
Mistake 4: Inconsistent icons. Using different icon styles or sizes for similar components creates confusion. Stick to the official Azure icons.
Mistake 5: Outdated diagrams. A diagram without a last-updated date is assumed to be wrong. Include metadata and update regularly.
Mistake 6: Ignoring security boundaries. Not showing VNets, subnets, or security groups misses a critical part of the architecture story.
Summary
A simple Azure architecture diagram is the best way to start learning about cloud design and communicate your ideas. By understanding the core services, following best practices, and using the right tools, you can create diagrams that are clear, effective, and accurate.
Key takeaways:
| Element | Description |
|---|---|
| Core components | Compute, storage, databases, networking, security, and management services |
| Best practices | Use standard notations, directional arrows, clear labels, consistency, accuracy, metadata, official icons, and keep it simple |
| Common example | Basic Web Application (App Service + SQL Database + Entra ID + Azure Monitor) |
| Tools | Draw.io, Microsoft Visio, FigJam, Lucidchart, AI-powered generators |
The tooling landscape has shifted. AI-powered generators can now turn natural language descriptions into production-ready Azure diagrams in seconds, changing the workflow from hours of manual dragging to seconds of generation with minutes of review.
To start creating your own simple Azure architecture diagrams, explore the Azure architecture diagram tool for templates and practical examples. For automated diagram generation, try the AI cloud diagram generator to turn an Azure description into a visual instantly. For complete system architecture beyond Azure, the AI system architecture generator covers distributed and enterprise system designs.
Stop spending hours on diagrams. Start documenting your Azure architectures in a way that actually keeps pace with your infrastructure.