
Visualizing EC2 Infrastructure: Tools That Actually Work in 2026
Visualizing your EC2 instances and the infrastructure around them is one of those tasks that sounds simple until you actually try to do it. You spin up a few instances, add an Application Load Balancer, hook up an RDS database, configure some security groups, and suddenly you have a complex system that's hard to explain to anyone, including yourself six months later.
The good news is that you have more options in 2026 than ever before. Here's a practical breakdown of the tools and approaches that actually work, from AI-powered generators to live infrastructure scanners.
Cloud Architecture
Create cloud architecture diagrams for AWS, Azure, GCP, and more. Design scalable infrastructure with professional cloud icons.
Practical guide to visualizing EC2 infrastructure in 2026, AI text-to-diagram, live AWS scanners, Terraform parsers, manual tools, and AWS-native visualization options.
Click Cloud Architecture to open AI Line Studio and generate diagrams from natural language in seconds.
The Four Ways to Visualize EC2 Infrastructure
| Method | How It Works | Best For |
|---|---|---|
| AI text-to-diagram | Describe your infrastructure in plain English; AI generates the diagram | Rapid prototyping, design documentation, stakeholder presentations |
| Live cloud scanning | Connects to your AWS account and reverse-engineers your infrastructure | Always-current documentation of existing systems |
| Infrastructure-as-code parsing | Reads Terraform or CloudFormation to generate diagrams | Keeping diagrams in sync with your code |
| Manual diagramming | Drag, drop, and connect shapes on a canvas | One-off diagrams, polished presentations, brainstorming |
1. AI Text-to-Diagram: The Fastest Way to Get Started
This category is transformative. You type a description of your infrastructure, and the AI builds the diagram for you in seconds.
- 3,000+ officially licensed icons across AWS, Azure, GCP, and OCI
- Animated diagrams (GIF, MP4) built for demos, training, and presentations
- Multi-format export: PNG, GIF, MP4, plus shareable documentation links
- Enterprise-grade collaboration and security features
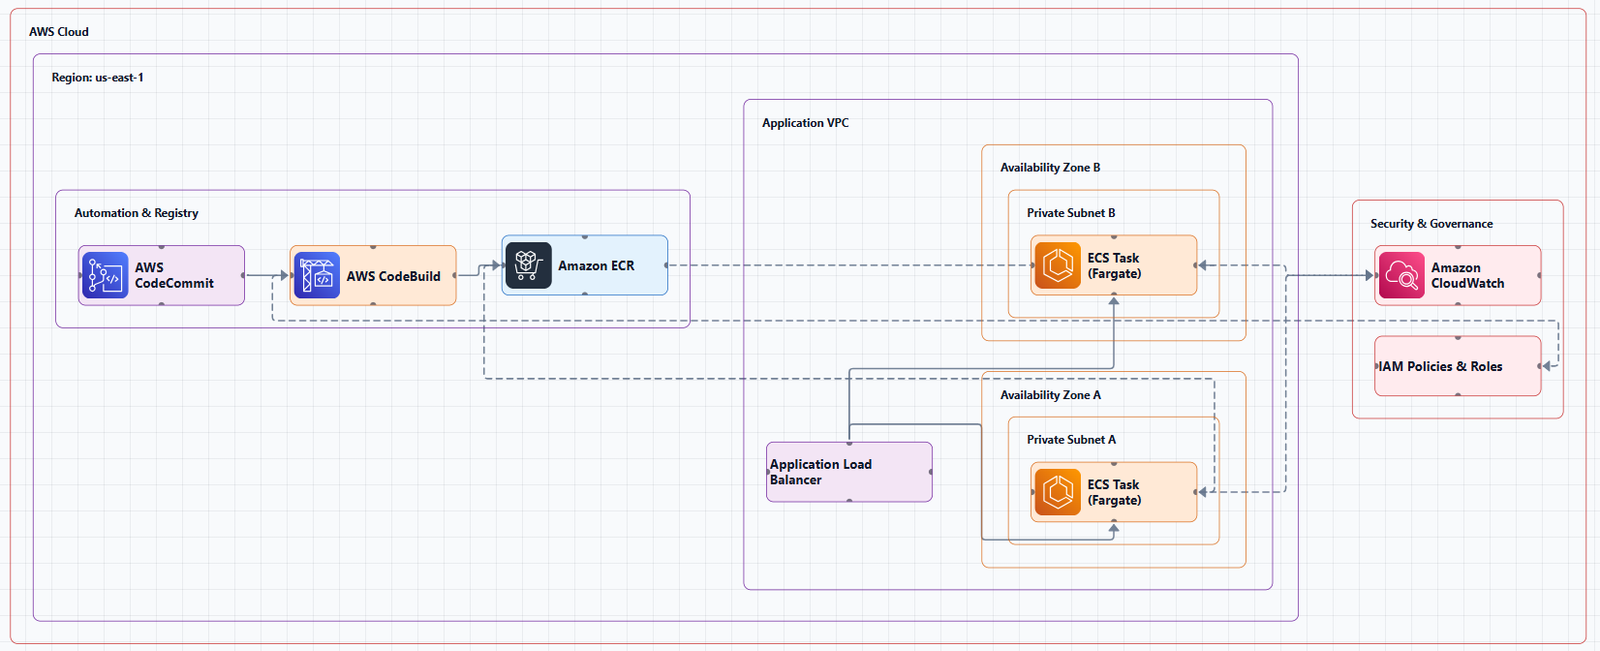
AI Line Studio, Best Value at $19/Month
AI Line Studio turns plain-language descriptions into production-ready architecture diagrams in 15 to 20 seconds. Describe "an application load balancer in front of EC2 instances across three availability zones, with an RDS database in a private subnet," and the tool generates a structured diagram from that description.
Key features:
Why it's different: Most diagramming tools are canvas-first. AI Line Studio is prompt-first, the diagram is the output of a description, not the output of manual drawing. Animation as a native export format is a genuine differentiator.
The honest limitation: It's an early-stage product with a smaller install base and fewer enterprise deployments than established tools. Complex descriptions may need manual cleanup; it's not a zero-review tool for mission-critical documentation.
| Tool | Monthly Price | Generations | Cost Per Diagram |
|---|---|---|---|
| AI Line Studio | $19 | 200 | $0.10 |
| Cloudcraft | $49 | Unlimited | $49/month flat |
| Lucidchart | $55+ | Unlimited | $55+/month per user |
For teams creating 5 diagrams per month, that's $3.80 per diagram, far less than the flat fees of competitors.
Get started: Visit the AWS diagram generator to create EC2 infrastructure diagrams from natural language.
Visual Paradigm AI Cloud Architecture Studio
Visual Paradigm offers a browser-based AI Cloud Architecture Studio that builds professional diagrams from plain English descriptions.
How it works:
- Describe your system in plain English
- Choose AWS and select a deployment strategy (Low Cost/MVP or High Availability)
- The AI asks clarifying questions to refine the stack
- Click Generate to build an interactive diagram using official AWS icons
- Use the AI Modify tool to refine with follow-up prompts
Key benefits: Well-Architected alignment, interactive editor, and high-res SVG export.
MockFlow IdeaBoard, Free to Start
MockFlow's AI AWS diagram generator supports 50+ AWS services including EC2, Lambda, S3, RDS, DynamoDB, CloudFront, Route53, API Gateway, ECS, EKS, and more.
How it works: Type your cloud infrastructure in plain text, name the services, describe the connections, specify the provider, and AI produces a complete architecture diagram with official icons, brand-accurate colors, and proper VPC structures.
Open-Source AI Diagram Generators
- diagram-ai-generator: AI-powered architecture diagram generator with MCP server integration for AWS, Azure, GCP, and Kubernetes
- Infrastructure Diagram MCP: Open-source MCP server for AWS, Azure, GCP, Kubernetes, and more
- cloud-diagram-mcp: Visualizes Terraform plan changes as diagrams with official AWS, Azure, and GCP icons
2. Live Cloud Scanning: Always-Accurate Diagrams of Your Existing Infrastructure
These tools connect to your AWS account and auto-generate diagrams from live data. They're the only category that stays current without manual effort.
AWS Workload Discovery, Free (Self-Hosted)
AWS Workload Discovery (formerly AWS Perspective) helps visualize your AWS environment, providing insights into resource relationships, architecture, and more.
How it works: By connecting to your AWS environment, it maps your existing resources, EC2 instances, RDS databases, VPCs, and more, and generates diagrams that show how they interact.
Key features:
- Live data scanning across accounts and regions
- Interactive web UI with drag and zoom
- Export for annotation in third-party tools
- Automatic updates every 15 minutes
The catch: You deploy and maintain it yourself. Being first-party, it avoids third-party security concerns.
Cloudcraft by Datadog, Free Tier Available
Cloudcraft automatically generates real-time diagrams of your AWS or Azure architecture by reverse-engineering resources in your cloud account.
Key features:
- Auto-layout of components and relationships
- Version history tracking with color-coded changes
- Live scanning that saves hours of manual work
- Filtering by EC2 instances, VPCs, and more
The catch: Free tier is limited. Paid plans start at $49/month.
Lucidscale, Automated AWS Visualization
Lucidscale makes it easy to automatically visualize your AWS infrastructure with filtering and customization based on EC2 instances, VPCs, and more.
lab-visualizer, Open-Source Real-Time Insights
A web application that provides a visual representation of AWS infrastructure state, aggregating data from AWS APIs and Terraform state files.
What it visualizes: Internet Gateways, NAT Gateways, Elastic IPs, and more.
cloudwire, Live Scanning Without Terraform
CloudWire queries your AWS account directly via boto3, discovering resources and relationships in real time, no Terraform required.
3. Infrastructure-as-Code Parsing: Diagrams from Your Code
For teams using Terraform or CloudFormation, these tools generate diagrams directly from your code.
terraformgraph, Interactive Diagrams from Terraform
Generate interactive architecture diagrams from Terraform configurations with automatic service grouping, relationship detection, and SVG/HTML output.
AWS resources supported: 100+ AWS resource types including EC2 (Instances, Auto Scaling Groups, Launch Templates), ECS (Clusters, Services, Task Definitions), and more.
auto-state-graph, From Terraform State to Diagram
Generate an AWS architecture diagram directly from a Terraform state file, inferring resource relationships and rendering with the diagrams library (Graphviz).
diagrams-js, TypeScript Diagram as Code
A TypeScript/JavaScript port of the popular Python diagrams library for drawing cloud system architecture diagrams as code.
Key features:
- Diagram as Code in TypeScript
- 17+ cloud providers including AWS, Azure, GCP, and Kubernetes
4. Manual Diagramming: Full Control, Zero Cost
Sometimes you need a polished diagram for a presentation, or you want to design something new from scratch. These tools give you full control.
draw.io (diagrams.net), Completely Free
draw.io is the most popular free diagramming tool. It has built-in AWS icon libraries, works in the browser, exports to PNG/SVG/PDF, and integrates with Confluence and Google Drive.
AWS-specific features:
- Built-in AWS icon libraries, including 3D and isometric shapes
- AWS templates accessible via Arrange > Insert > Template > Cloud > AWS
- AWS Groups shape library for indicating groupings of elements
- Import from Cloudcraft and Cloudockit exports
The catch: It's entirely manual. Your diagram is outdated the moment your infrastructure changes.
AWS-Native Visualization Tools
AWS itself provides several ways to visualize your EC2 infrastructure:
Amazon EC2 Global View
Amazon EC2 Global View lets you visualize some of your Amazon EC2 and Amazon VPC resources in a single AWS Region or across multiple Regions in a single console.
What it shows: A global summary of resources across all Regions where your AWS Account is enabled.
Amazon EC2 Topology
Amazon EC2 topology provides a hierarchical view of the relative proximity of your compute capacity.
Use case: Manage high performance computing (HPC), machine learning (ML), and generative AI compute infrastructure at scale.
Amazon CloudWatch Visual Agent Configuration
Amazon CloudWatch now provides a visual configuration editor for the CloudWatch agent directly in the Amazon EC2 console, enabling you to set up and manage observability for your EC2 instances without hand-editing JSON.
Decision Framework: Which Tool Should You Use?
| Your Primary Need | Recommended Tool | Why |
|---|---|---|
| AI-powered speed + best value | AI Line Studio ($19/mo) | 15-second generation, animated exports, 200 generations/month, prompt-first |
| Completely free manual diagram | draw.io | Fast, free, good enough, offline capable |
| Live infrastructure visualization (self-hosted) | AWS Workload Discovery | First-party, free, always-current |
| Live infrastructure visualization (SaaS) | Cloudcraft | Real-time diagrams, cost estimation, auto-layout |
| Automated AWS visualization | Lucidscale | Filter by EC2, VPC, and more |
| Diagrams from Terraform code | terraformgraph | 100+ AWS resources, interactive HTML output |
| Open-source AI generation | diagram-ai-generator | MCP server integration, works with Claude Desktop |
| Real-time infrastructure insights | lab-visualizer | Aggregates AWS APIs and Terraform state |
Common Mistakes When Visualizing EC2 Infrastructure
Mistake 1: Not reviewing AI-generated output. AI-assisted tools can generate diagrams quickly, but they're not infallible. Complex descriptions may produce incorrect relationships. Review before sharing.
Mistake 2: Using a live scanner for design. Auto-generated diagrams show your current state, not your intended architecture. Use AI or manual tools for planning new architectures.
Mistake 3: Paying for features you don't need. If you create 10 diagrams a month, a $55/month subscription is overkill. AI Line Studio's $19/month plan gives you 200 generations.
Mistake 4: Using outdated icons. AWS updates its icon set regularly. Always use the latest official icons.
Mistake 5: Treating diagrams as a one-time activity. Infrastructure changes constantly. Your diagrams should too. Use automated tools to keep them current.
External Resources
- AWS Architecture Icons (Official), official source for AWS product icons
- AWS Workload Discovery, AWS's self-hosted visualization tool
- AWS Architecture Center, reference architectures, best practices, and design guidance
- AWS Well-Architected Framework, guidance for designing secure, reliable, efficient workloads
- draw.io, free diagramming tool with AWS shape libraries
- terraformgraph, open-source Terraform-to-diagram generator
- AI Line Studio, $19/month for 200 diagram generations
Final Thoughts
Visualizing your EC2 instances and infrastructure doesn't have to be a painful manual process. In 2026, you have options ranging from AI-powered text-to-diagram tools that generate in 15 to 20 seconds, to live scanners that reverse-engineer your entire AWS account, to Terraform parsers that keep diagrams in sync with your code.
For most teams, the sweet spot is AI Line Studio at $19/month for 200 generations. It's prompt-first, generates diagrams in seconds, exports animated GIFs and MP4s, and uses 3,000+ official AWS icons. At $0.10 per diagram, it's the most cost-effective option on the market.
If you want something completely free, draw.io is the gold standard for manual diagramming. If you need always-current diagrams of existing infrastructure, AWS Workload Discovery or Cloudcraft will save you hours. If you're using Terraform, terraformgraph keeps your diagrams in sync with your code.
The right tool depends on what you're trying to do. Start with the tool that matches your workflow. And remember: with modern automation, your diagrams can stay current, so actually keep them that way.